Biodiversity: counts, evenness and useful functions
By UK A Level Environmental Science · independent study · myAudience
myAudience original educational concept illustration. Image: illustration, not a documentary photograph. · Original generated educational concept plate with retained actual prompts, receipts and rejected predecessors; no third-party logos or measured data.
Biodiversity: counts, evenness and useful functions
Biodiversity is not interchangeable with the number of organisms counted. Two communities can contain the same total abundance but different species composition; two can contain the same species richness but different evenness. Richness counts the taxa represented under a defined sampling method. Evenness describes how their individuals are distributed. Sampling effort and identification resolution affect both, so comparisons need compatible methods and an explicit taxonomic level.
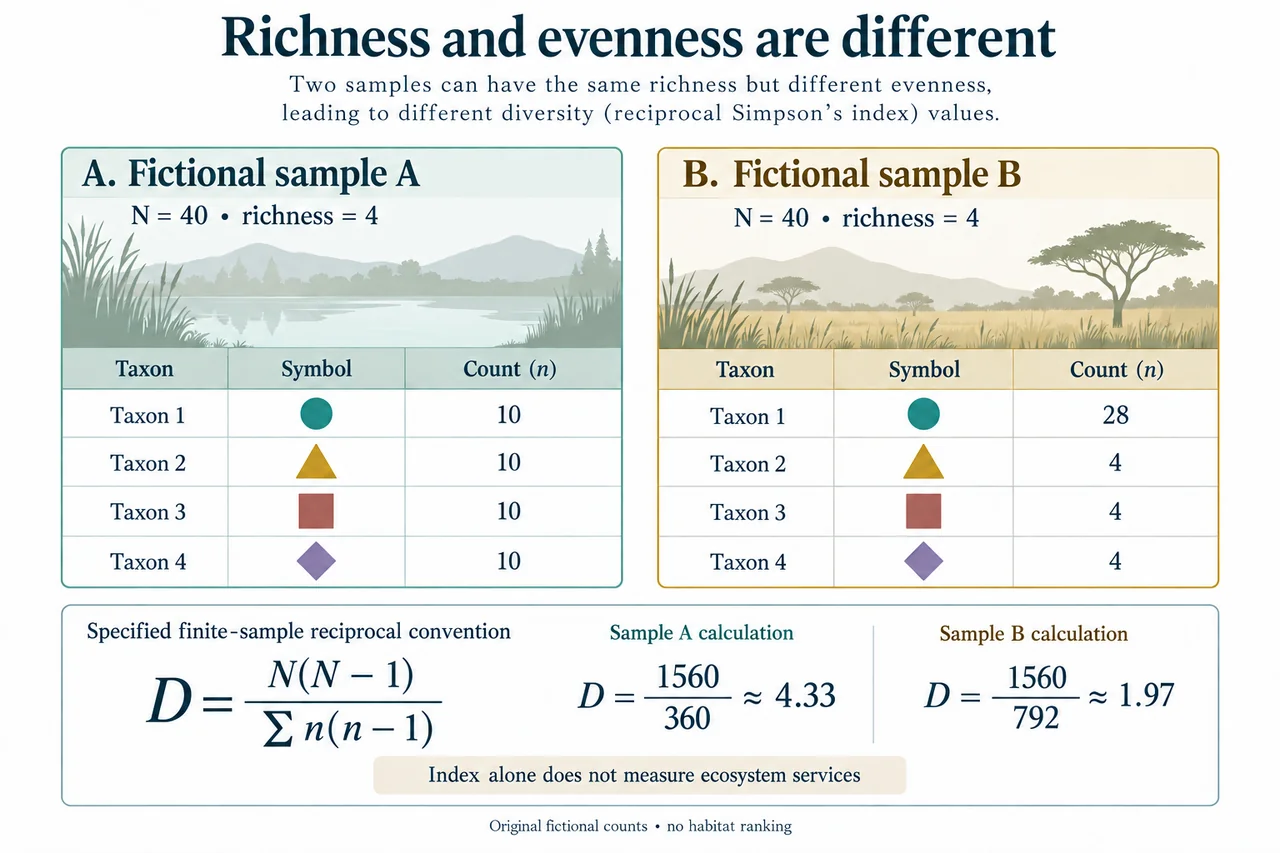
Consider two invented samples of 40 individuals across four taxa. Sample A contains 10 individuals of each taxon. Sample B contains 28 of the first and 4 of each remaining taxon. Both have richness 4 and abundance 40, yet B is dominated by one taxon. The counts alone do not reveal which taxa perform a particular ecosystem function or whether the samples represent whole habitats rather than selected points.
Diversity indices compress composition into a number using a stated convention. current specification prints the reciprocal finite-sample form D = N(N − 1)/Σn(n − 1), where N is total individuals and n is each taxon count. Other texts use a concentration or its complement. These are related but have different scales and directions, so comparing numbers without naming the formula can reverse or distort an interpretation.
For sample A, the denominator is 4 × 10 × 9 = 360 and the numerator is 40 × 39 = 1560. The specified reciprocal index is therefore 1560/360≈4.33. For B, 28 × 27 + 3 × 4 × 3 = 792, giving 1560/792≈1.97. With this convention A has the larger value, consistent with its more even counts. All organisms and results here are fictional; the index is not a measured rating of a named reserve.
The finite-sample reciprocal estimate is not bounded above by the observed richness in every sample: A’s 4.33 already exceeds 4. That is not an instruction to invent a fifth species. The numerator and denominator count ordered pairs without replacement; their ratio estimates a reciprocal concentration. For very small or degenerate samples the denominator can vanish, making the ratio undefined. Reporting the actual formula avoids confusing this estimator with a different index whose range is 0 to 1.
Ecosystems provide material, regulating and non-material benefits, but a diversity index does not measure all those contributions. Pollination depends on interactions and timing, water regulation depends partly on soils and landscape structure, and cultural value cannot be reduced to a count table. CBD’s guidance on nature’s contributions to people identifies varied benefits and trade-offs. A management decision needs relevant function measurements alongside composition and the views of affected communities.
The diagram displays four taxon symbols with exact count tables for A and B, the shared N = 40 and both denominator calculations. Symbols stand for unnamed taxa rather than identifiable protected species. Its service caution identifies a question to investigate rather than a benefit proved by the larger index. The plate’s finite-sample reciprocal label is essential: reading only a large 4.33 without the convention would miss why the number can exceed richness.
A useful comparison asks whether the sampling design could produce the apparent difference. Different seasons, quadrat sizes or identification practices can alter results without a management effect. Repeated representative observations can test persistence, while function measurements can test an intended benefit. A justified recommendation would retain the composition result, consider alternatives and describe whose interests are affected rather than declaring the more even sample universally healthier, more valuable or more resilient.
Worked example: Two managers compare fictional 40-individual samples A = 10/10/10/10 and B = 28/4/4/4. One says richness proves equivalence; another says A’s reciprocal index proves superior pollination. Evaluate both claims using stated formula.
The samples have equal abundance and equal observed richness: each contains 40 individuals and four taxa. That supports a limited statement about these two measures under the supplied classification. It does not establish equivalent community composition. Sample A assigns one quarter of its individuals to each taxon, whereas B assigns 70% to the first taxon and 10% to each other taxon. B is therefore less even in this count comparison.
Using the specified reciprocal finite-sample formula, the numerator for both samples is 40 × 39 = 1560. A’s denominator is four contributions of 10 × 9, giving 360, so D_A = 1560/360≈4.333. B’s denominator is 28 × 27 + 3 × 4 × 3 = 756 + 36 = 792, so D_B≈1.970. The larger A value is consistent with the stated convention and greater evenness; a complementary 0-to 1 formula would produce different numbers and must not be silently substituted.
A’s estimate exceeds the observed richness 4 because this particular finite-sample estimator uses pairs without replacement. It does not imply an unobserved fifth taxon. The calculation answers an index question, not a complete ecological assessment. Before interpreting the difference as a habitat or management effect, I would ask whether effort, location, season, quadrat design and identification resolution were comparable and whether replicated representative samples show a persistent difference.
The pollination claim requires another logical step that the counts do not supply. The unnamed taxa could have different functional roles, activity periods and plant associations. Neither table measures pollinator visitation, successful fertilisation or the timing of plant flowering. A larger diversity value cannot by itself demonstrate greater pollination or quantify the benefit to people. Relevant observations and alternative explanations would be needed to test that proposed service.
I therefore reject equivalence based solely on richness while accepting equal richness as one valid observation. I also reject demonstrated superior pollination, while accepting that A is more even and has the larger specified reciprocal index in these fictional samples. A responsible recommendation would combine repeated composition measurements with the actual desired function, habitat context and community interests. That preserves what the arithmetic establishes without converting a summary statistic into a universal ecological quality score or a measured causal service claim.
Answer: Both samples have richness 4, but their evenness differs and the specified reciprocal indices are about 4.33 and 1.97. These counts support that composition comparison, not a demonstrated pollination advantage or universal ecological ranking.
Check your understanding: A fictional sample contains 6 individuals of taxon X and 2 of taxon Y. Calculate the specified reciprocal D. Another contains one individual of each of 8 taxa; why cannot this same ratio give a finite result? Does that calculation failure mean no biodiversity?
Answer: For 6/2, N = 8 and Σn(n − 1) = 6 × 5 + 2 × 1 = 32, so D = 56/32 = 1.75. For eight singletons every n(n − 1) = 0, so the ratio has a zero denominator and is undefined. It does not mean absent biodiversity: observed richness is 8, while this particular estimator cannot give a finite reciprocal concentration from that sample.
Why: Use the declared boundaries, units, fictional values and assumptions; evaluate alternatives and specify missing evidence. These original practice tasks do not establish independent assessed mastery or first-hand practical completion.