Representative samples: weighting before a conclusion
By UK A Level Environmental Science · independent study · myAudience
myAudience original educational concept illustration. Image: illustration, not a documentary photograph. · Original generated educational concept plate with retained actual prompts, receipts and rejected predecessors; no third-party logos or measured data.
Representative samples: weighting before a conclusion
A sample represents a defined target, not every environment automatically. Before choosing locations, specify the population, area, interval and quantity to estimate. A habitat-wide density estimate requires attention to where the samples came from and how much area each habitat type occupies. Taking many measurements at one convenient point can increase precision for that point without correcting an unrepresentative design.
Random location selection can reduce deliberate selection bias when the relevant conditions permit it. Systematic intervals can be useful along an environmental gradient. Where distinct habitat strata differ, estimating each separately and weighting by their areas can preserve their contribution to the whole. This is a design choice whose suitability depends on the question, not an assertion that one sampling layout solves every ecological study.
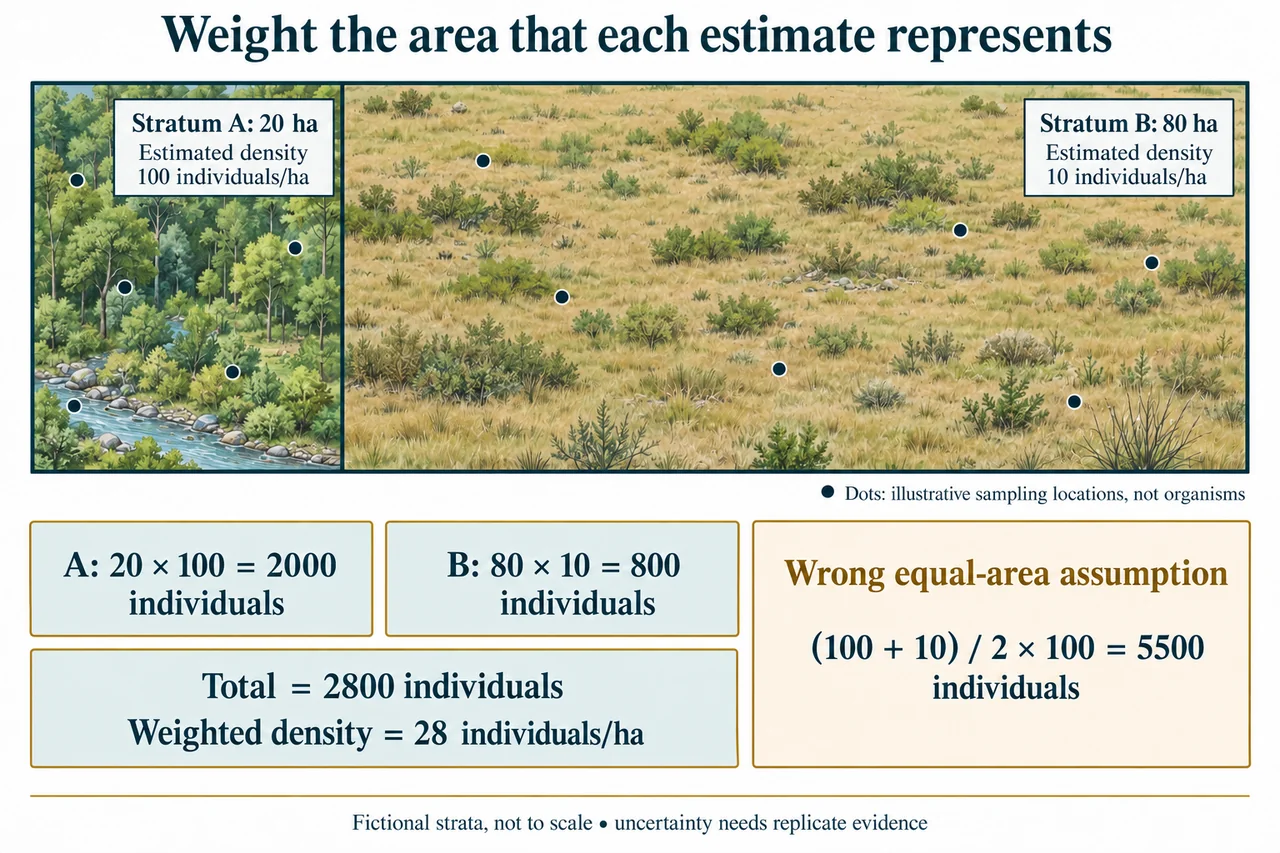
For a fictional 100 ha site, suppose a 20 ha habitat has estimated density 100 individuals/ha and the remaining 80 ha has estimated density 10 individuals/ha. Multiplying each density by its corresponding area gives 2000 and 800 individuals. Adding gives a habitat-wide estimate 2800, equivalent to a weighted density 28 individuals/ha. The densities are chosen teaching inputs, not exact counts of every individual on a real site.
A simple average of the two densities is 55 individuals/ha. Multiplying that by 100 ha gives 5500, but it assigns equal weight to habitat types covering unequal areas. The error is not arithmetic; it is an inappropriate representation of the target area. Equal numbers of samples within the two strata would not make their physical areas equal. Sampling allocation and estimation weights answer different questions.
Density estimates have uncertainty from sampling variation, imperfect detection, identification and changes through time. More genuinely independent observations can improve an estimate, while repeated readings from the same location may be correlated. Standardising quadrat dimensions, timing and procedures supports comparison. A point symbol on a plan does not establish that samples were random, independent or ethically collected.
Change the chosen densities to 80 and 15 individuals/ha, keeping areas 20 and 80 ha. Estimated numbers become 1600 and 1200, still summing to 2800. The same overall total now contains a different spatial distribution. Consequently, an unchanged headline estimate could conceal an ecologically important redistribution. An investigation should retain stratum results and evaluate habitat conditions rather than storing only the combined total.
The not-to-scale illustration shows two labelled strata with their declared areas, estimated densities and area-weighted totals; the drawn proportions are not calibrated measurements. Its sample-location dots explain where observations might be taken; they are not individual organisms and do not provide raw replicate data. The card contrasts 2800 with the inappropriate 5500 calculation. Reading the areas alongside the densities is essential to see why weighting changes the result.
Actual fieldwork needs supervised risk assessment, permissions and measures to minimise disturbance. requires first-hand methodologies and sampling techniques; a reading exercise cannot provide those experiences or certify the centre’s practical statement. This lesson supports planning and interpretation, while uncertainty estimation, suitable inferential testing and careful observation remain necessary parts of a defensible environmental conclusion.
Worked example: Two equal sets of quadrat estimates give densities 100 and 10 individuals/ha in habitat strata occupying 20 and 80 ha. An analyst estimates 5500 individuals by averaging densities first. Evaluate that estimate, then compare a changed-density scenario 80 and 15 with the same areas.
I define the target as total individuals across the full 100 ha site, rather than the average of two equally weighted habitat labels. Each estimated density must therefore be multiplied by the area it represents. The first stratum contributes 100 × 20 = 2000 individuals and the second 10 × 80 = 800. Their sum is 2800, with habitat-wide weighted density 2800/100 = 28 individuals/ha.
The analyst’s arithmetic produces(100 + 10)/2 = 55 individuals/ha and then 5500 individuals across 100 ha. The calculation implicitly treats the two strata as equal shares of area. They are not: their weights are 0.20 and 0.80. Using those weights directly gives 0.20 × 100 + 0.80 × 10 = 28. Equal numbers of sampled quadrats might help compare strata, but do not change their actual areas or justify substituting equal area weights.
The changed-density scenario preserves the 20 and 80 ha areas but assigns 80 and 15 individuals/ha. It gives 1600 and 1200 individuals respectively, again totalling 2800. The combined total is unchanged while estimated individuals in the first stratum fall 400 and those in the second rise 400. That shift could matter for habitat use or management, but the fictional inputs do not establish why it occurred or whether the difference is statistically distinguishable from sampling variation.
A rigorous report would retain stratum estimates, sampling methods, dates and uncertainty information. I would ask whether locations were representative, whether quadrat dimensions and detection procedures were consistent and whether repeat observations were genuinely independent. Standard deviation alone is not automatically a confidence interval, and nearby repeated readings may be correlated. The task supplies no replicate distributions, so I cannot invent an uncertainty range or a significance result.
I reject 5500 as the appropriate area-wide estimate under these inputs and report 2800 for both scenarios, with different spatial compositions. That conclusion is conditional on the supplied densities and areas. A real management comparison would need repeat field observations, relevant habitat evidence and supervised methods that minimise disturbance. The corrected estimator addresses a design-related weighting error; it does not certify real abundance, practical competence or the cause of a redistribution.
Answer: Area weighting gives 2800 individuals, not 5500. The changed densities also give 2800, but stratum totals change from 2000/800 to 1600/1200; the same total does not establish an unchanged distribution or cause.
Check your understanding: A fictional site has 30 ha estimated at 20 individuals/ha and 70 ha estimated at 40 individuals/ha. Find total individuals and weighted density. A 50:50 average gives 30 individuals/ha; explain why that is not the correct site-wide estimate.
Answer: The stratum totals are 600 and 2800, summing to 3400 individuals. Across 100 ha, weighted density is 34 individuals/ha. The simple mean 30 assigns equal area weights, although the actual shares are 0.30 and 0.70. Neither calculation supplies sampling uncertainty without replicate evidence.
Why: Use the declared boundaries, units, fictional values and assumptions; evaluate alternatives and specify missing evidence. These original practice tasks do not establish independent assessed mastery or first-hand practical completion.