Circular materials: recoverable is not lossless
By UK A Level Environmental Science · independent study · myAudience
myAudience original educational concept illustration. Image: illustration, not a documentary photograph. · Original generated educational concept plate with retained actual prompts, receipts and rejected predecessors; no third-party logos or measured data.
Circular materials: recoverable is not lossless
A circular material system aims to retain useful products and materials rather than follow a simple extraction-use-disposal chain. EPA’s current explanation includes reduced material demand, redesign and recovery within a life-cycle perspective. Recycling is one possible pathway, not a guarantee that every input returns indefinitely or that a recovered material always substitutes equally for a virgin one.
Material accounting needs a boundary and a basis. A mass balance tracks quantities crossing a defined system, while a functional comparison also asks what service the product provides. Collection determines how much discarded material enters recovery; the recovery process determines how much collected material becomes usable output. Confusing these stages can overstate the return fraction and hide distinct losses.
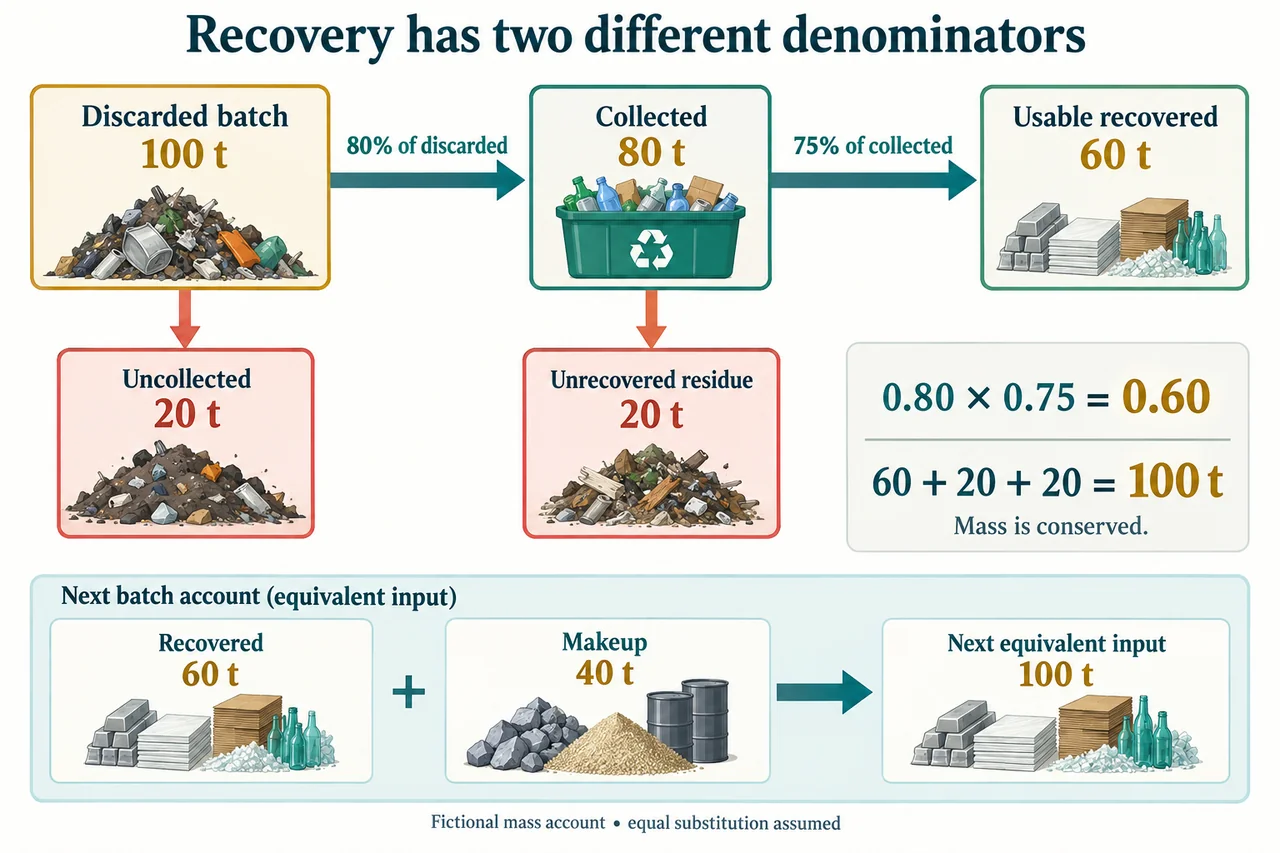
Choose a fictional 100 t discarded batch. If 80% is collected, 80 t enters recovery and 20 t remains uncollected within this account. If 75% of the collected mass becomes usable recovered material, 60 t returns and 20 t becomes unrecovered residue. The complete chosen balance is 100 = 60 + 20 + 20 t. Multiplying the stage fractions, 0.80 × 0.75 = 0.60, explains why neither individual percentage is the whole-system return rate.
If a following batch still requires 100 t of suitable input and the recovered 60 t can substitute on that same mass basis, 40 t of makeup input is needed. This is a declared equal-function assumption, not a measured guarantee of material quality. A process requiring additional additives or rejecting contaminated material would need an expanded boundary and different inputs. The makeup material is not automatically impact-free.
Repeated recovery does not preserve all original material. Applying the same chosen 0.60 return fraction again to the original recovered 60 t leaves 36 t from that original batch. Later makeup input can keep total product throughput at 100 t while the original-material fraction falls. A circular-arrow symbol can therefore be misleading if it suggests a perfectly closed, lossless cycle rather than an organised set of reuse and recovery pathways.
Collection 90% and usable recovery 80% would return 72 t per 100 t discarded, leaving 10 t uncollected and 18 t unrecovered residue. Required makeup would fall to 28 t under the same substitution assumption. That mass improvement is worth identifying, but its environmental value also depends on transport, processing energy, emissions, toxicity and product lifetime. More recovered tonnes alone do not establish a lower impact on every measure.
The plate explicitly splits the 100 t batch into 80 t collected and 20 t uncollected, then the 80 into 60 usable and 20 residue. Its next-batch input combines 60 recovered with 40 makeup. The graphic uses fictional numbers, not a real facility’s performance. Its arrows conserve mass and distinguish the collection and recovery boundaries so that a reader can identify where a proposed intervention acts.
A responsible circularity decision considers prevention, repair and longer product life alongside recovery. Avoided throughput may reduce material demand differently from improving an end-of-life percentage. Workers and neighbouring communities can also face unequal processing burdens. A conditional recommendation should compare equivalent services across a transparent life-cycle boundary, report uncertainties and check who receives the benefits rather than equating a closed-looking diagram with a complete sustainability assessment.
Worked example: An organisation claims its fictional 80% collection and 75% recovery stages give a 75% whole-system return, eliminate new inputs and prove lower environmental impact. Evaluate those claims for 100 t, then compare 90% collection and 80% recovery.
I distinguish the two denominators before evaluating the claim. Collection 80% applies to the 100 t discarded batch, giving 80 t collected and 20 t uncollected. Recovery 75% applies to that 80 t, not the original 100. It gives 60 t usable recovered material and 20 t unrecovered residue. The complete mass balance is 60 + 20 + 20 = 100 t, so whole-system return is 60%, not 75%.
For a next batch requiring 100 t of equivalent suitable material, the recovered 60 t leaves 40 t makeup input. This assumes recovered and makeup material substitute on the same mass and service basis. It does not establish that a particular real material meets a required quality. Applying the 60% return fraction again to the original 60 t retains 36 t of the original batch. Keeping total production at 100 t would therefore require continued makeup, even if circular arrows appear on the diagram.
Under the proposed improvement, 90 t is collected and 10 t remains uncollected. Usable recovery 80% of 90 is 72 t; the unrecovered residue is 18 t. The mass account is 72 + 18 + 10 = 100 t. Makeup falls to 28 t for the same 100 t input requirement. This is a 12 t reduction in makeup relative to 40 t, or 30% of that earlier makeup amount, not a 12% reduction on every possible environmental indicator.
The improvement supports a narrower material-accounting conclusion. It does not prove that all impacts decline, because the task provides no transport, processing-energy, emissions, toxicity or service-life data. Collecting additional dispersed material could require more transport, while contamination could affect product quality. A comparison must use consistent boundaries and equivalent services rather than treating a recovered tonne as a universal unit of environmental benefit.
I reject the 75% whole-system rate, the no-new-input claim and the unsupported all-impact conclusion. The original account returns 60 t and needs 40 t makeup; the improved account returns 72 t and needs 28 t under the declared substitution model. Before recommending a real system, I would compare prevention, repair, product lifetime and recovery using reliable life-cycle evidence, while considering worker safety and neighbouring communities. These calculations reveal the mass pathways but do not certify a facility, a material specification or complete sustainability.
Answer: Whole-system return is 60%, needing 40 t makeup; the improvement returns 72 t and needs 28 t. Those mass results do not eliminate new inputs or establish lower impact on every life-cycle measure.
Check your understanding: A fictional 50 t discarded batch has 70% collection and 60% usable recovery of collected material. Calculate usable return, both loss pathways and makeup for a 50 t equivalent next batch. Would adding 70% + 60% be a valid return percentage?
Answer: Collection yields 35 t and leaves 15 t uncollected. Recovery yields 21 t usable and 14 t residue. The balance is 21 + 14 + 15 = 50 t; return is 42% and next-batch makeup 29 t. Adding stage percentages gives 130%, which is invalid because they have different denominators; multiply 0.70 × 0.60 instead.
Why: Use the declared boundaries, units, fictional values and assumptions; evaluate alternatives and specify missing evidence. These original practice tasks do not establish independent assessed mastery or first-hand practical completion.