Reading a heating curve as an energy account
By UK GCSE Physics · independent study · myAudience
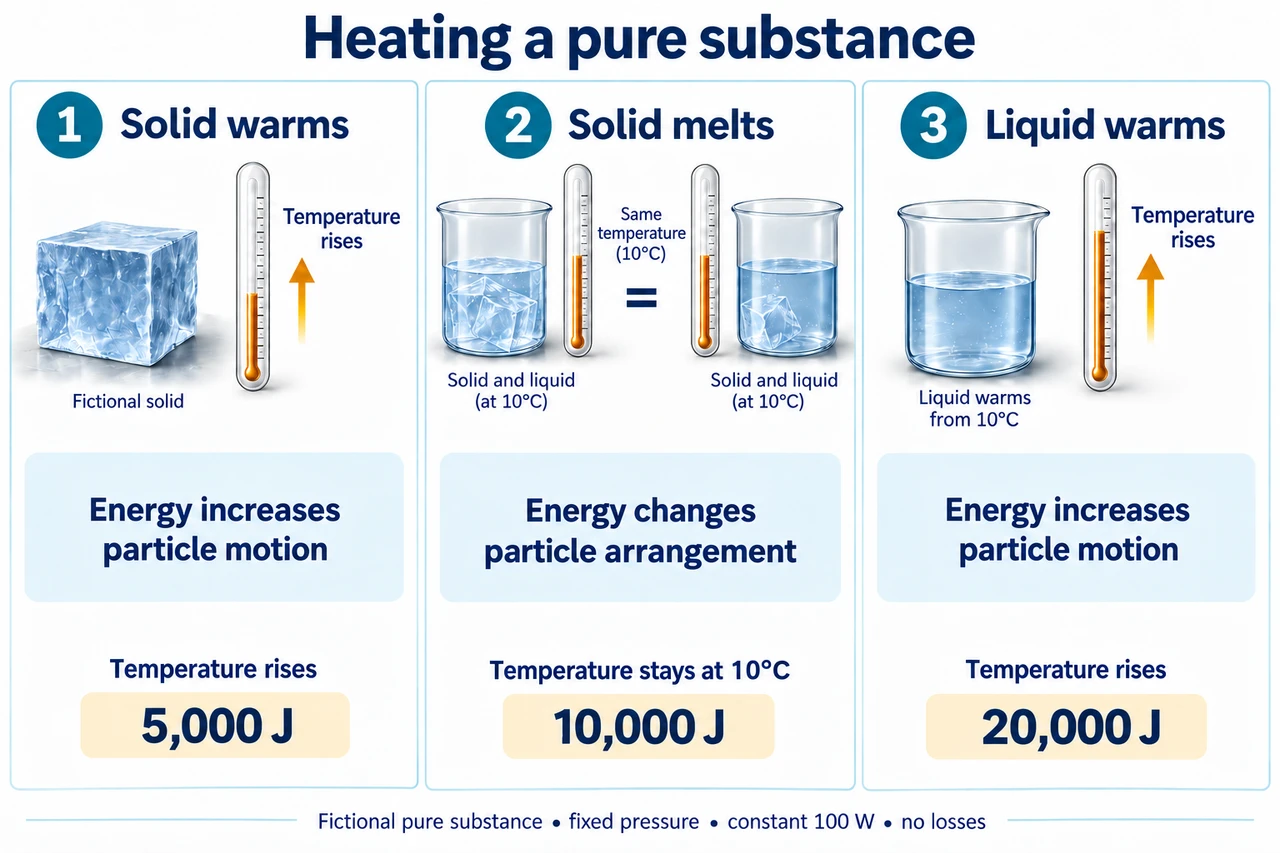
Image: illustration, not a documentary photograph. Three equal-width explanatory stages for a fictional material; panel width is not time or energy scale. The exact heating-curve coordinates are supplied in the model text. · Original AI-generated illustration; independently reviewed scientific teaching model.
Reading a heating curve as an energy account
A heating curve plots temperature against time or transferred energy. Its shape becomes useful only when the axis and process are specified. For a pure substance at fixed pressure, a sloping section can represent warming within one phase and a plateau can represent a phase change. A horizontal section is not a pause in energy transfer. If net power continues, energy accumulates in the phase-change account while temperature stays constant. Real data require examination of losses, sensor response and whether the sample is a pure substance.
Construct a complete original model rather than guessing durations from a decorative curve. Our fictional 0.50 kg material starts as a solid at 0°C, melts at 10°C and ends as liquid at 30°C. Take solid c = 1000 J/(kg·°C), fusion L = 20000 J/kg and liquid c = 2000 J/(kg·°C). Assume fixed pressure, constant 100 W net power and no losses. These values define a hypothetical material; they are not claims about water. The three stages must use the appropriate equation and their own temperature interval.
First warm the solid through 10°C. Energy=0.50×1000×10=5000 J. With 100 J transferred each second, this takes 50 s. Next change 0.50 kg from solid to liquid: energy=0.50×20000=10000 J, taking 100 s. The plateau therefore extends from 50 s to 150 s, not from 0 s to 100 s. Then warm the liquid through 20°C:0.50×2000×20=20000 J, taking 200 s. Completion occurs at 350 s after 35000 J net transfer.
An accurate numerical plot would pass through(time,temperature) points(0 s,0°C),(50 s,10°C),(150 s,10°C) and(350 s,30°C) with a linear time axis. Its first slope is 10/50=0.20°C/s; the last is 20/200=0.10°C/s. At the same mass and net power, the liquid stage rises more slowly because its assumed specific heat is larger. Plateau length depends on mass, latent heat and power, not on an absence of heating. Using equal-width sections would misrepresent these unequal durations.
Our rendered image intentionally shows three explanatory stages, not a calibrated graph. Equal panel widths are layout choices and cannot be read as equal times or energy amounts. The printed 5000,10000 and 20000 J are the separately computed stage energies. The area beneath a temperature-time curve is not the heat supplied: its units would be temperature multiplied by time. Energy is obtained from power multiplied by duration here. Distinguishing a representation from the quantitative model is part of reading scientific graphics responsibly.
Changing net power changes times without changing the stage energies for the same endpoints and ideal material values. At 50 W, each duration doubles to 100,200 and 400 s, so completion takes 700 s. However, a heater rated 100 W with unmeasured losses does not guarantee 100 W net power at the material. If losses increase as the sample warms, the observed slope need not remain constant even within one phase. This is a reason to state the ideal assumptions before comparing a calculated curve with real observations.
To solve a new graph problem, locate each state boundary, list the energy equation for each stage, and keep cumulative time distinct from stage duration. Check mass and phase values before adding energies. A partly completed plateau means some original phase remains; energy beyond a completed plateau must enter a later stage. A sloping measured section is not enough to identify a chemical substance, and the phase-change temperature alone is not a definitive material fingerprint. Use additional evidence rather than treating a familiar picture as proof.
Worked example: Determine stage energies, stage times, cumulative points and total time for the fictional material.
Solid warming 5000 J/100 W=50 s.
Melting 10000 J/100 W=100 s, finishes at 150 s.
Liquid warming 20000 J/100 W=200 s, finishes at 350 s.
Total 35000 J, 350 s; points(0,0),(50,10),(150,10),(350,30) in(s,°C).
Answer: 5000/10000/20000 J; 50/100/200 s; total 350 s.
Check your understanding: The heater runs at 50 W net. A reader says the plateau lasts 200 s and the whole run takes 600 s. Evaluate both numbers.
Answer: Plateau energy is unchanged 10000 J, so its duration 10000/50=200 s is correct. Solid warming takes 5000/50=100 s and liquid warming 20000/50=400 s. Total 100+200+400=700 s, so 600 s is incorrect. The plateau ends at 300 s cumulative time. This conclusion requires 50 W net throughout; a rated input with changing losses is insufficient.
Why: Apply the explicit system boundary, units and model limits stated above. This original supplied transfer is not a recorded practical or completed assessment.