Collisions, activation barriers and alternative pathways
By UK A Level Chemistry · independent study · myAudience
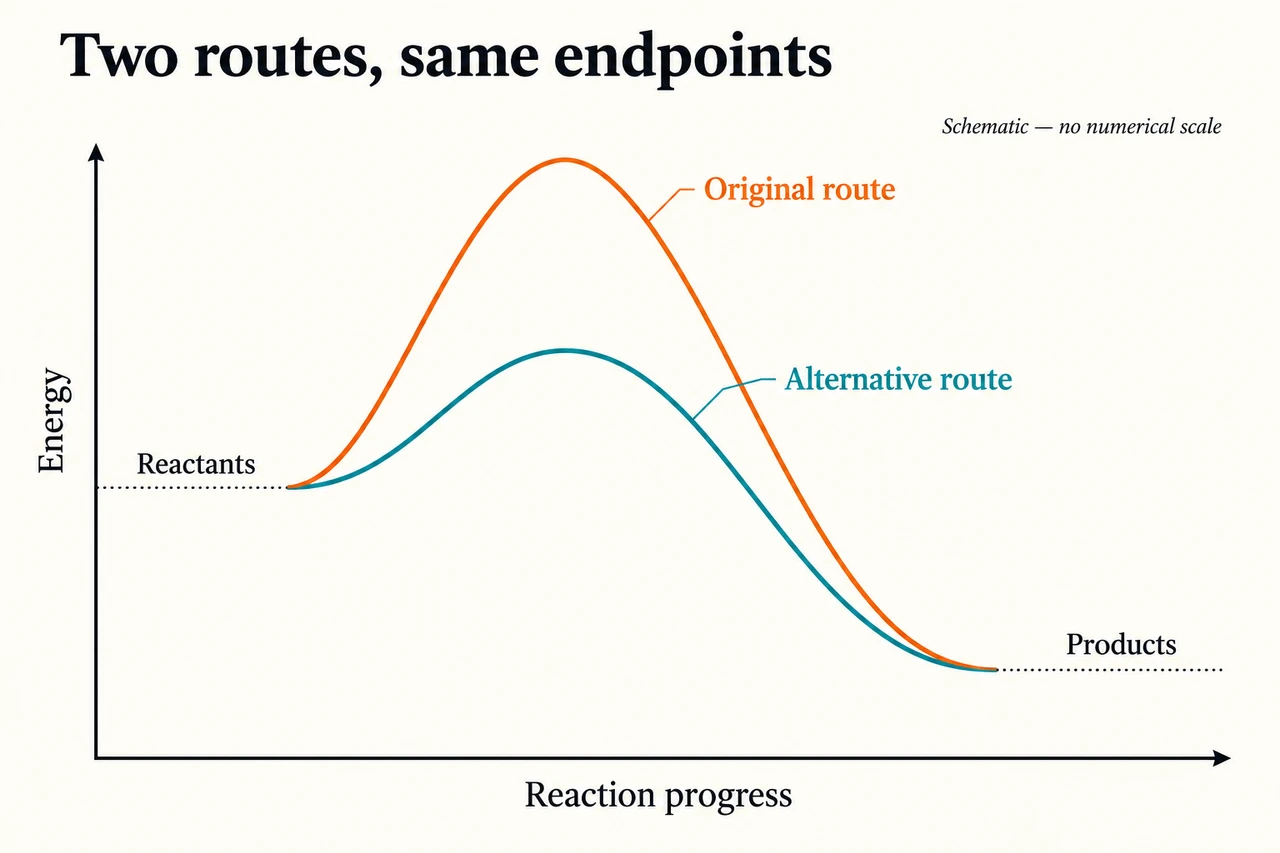
Image: illustration, not a documentary photograph. Supplied single-peak energy model with common endpoints; reaction progress is not time, and no real catalyst or measured reaction is identified. · Original AI-generated illustration; independently reviewed scientific teaching model.
Collisions, activation barriers and alternative pathways
A chemical equation accounts for substances and amounts; it does not guarantee that every meeting of its particles produces a reaction. Reactant particles must encounter one another with enough energy to enter a reaction pathway. In many molecular reactions, orientation also matters because particular parts of molecules must interact. Activation energy is the minimum energy barrier for the specified route, measured per mole in an energy profile. Most encounters can therefore fail even in a mixture containing the correct reactants. Counting collisions and identifying successful collisions are different questions.
An energy profile puts reaction progress on the horizontal axis and the energy of the reacting system on the vertical axis. The peak represents the barrier associated with a transition state; it is not a stable intermediate that can be collected in a bottle. The forward activation energy is the difference between the reactant level and that peak. The enthalpy change is the product level minus the reactant level. An exothermic endpoint below the reactants does not eliminate the upward barrier: energy must still be supplied to reach the route before the larger energy release.
For a simple single-peak profile, reading the same peak from the product side gives the reverse activation energy. Suppose an abstract forward reaction has ΔH = −20 kJ mol⁻¹ and a forward barrier of 60 kJ mol⁻¹. Taking the reactant level as zero puts products at −20 and the peak at +60, so the reverse barrier is 80 kJ mol⁻¹. This is an energy-difference model, not a measured reaction or a rule that real mechanisms always have one step. Several steps can contain several transition states and intermediate minima, and the slowest controlling process must be established from evidence.
Increasing concentration at a fixed temperature generally puts more reacting particles into each unit volume. Their encounters become more frequent, so there can be more successful collisions each second without changing the energy requirement of an individual collision. For reacting gases, increasing pressure by reducing volume at fixed temperature raises particle number density. Adding an inert gas at fixed volume does not raise the concentrations of the reactant gases in the ideal mixture model. Always specify how pressure was changed; a pressure reading alone does not describe the encounter conditions.
A catalyst provides an alternative reaction route with a lower activation barrier and is regenerated overall. It may take part in intermediate steps, so unchanged overall amount does not mean that it never interacts with a reactant. In the supplied profile, lowering the forward barrier from 60 to 25 kJ mol⁻¹ while retaining the same endpoints also lowers the reverse barrier from 80 to 45. Both directions can proceed faster. The catalyst changes the route, not the reactant-to-product enthalpy difference, and does not supply an energy subsidy that changes the final chemical equilibrium.
Collision reasoning explains qualitative changes, but it does not determine a rate law from the balanced equation. Doubling a concentration cannot automatically be declared to double the measured rate: orders and mechanisms require suitable experimental evidence. Likewise, a barrier reduction of 35 kJ mol⁻¹ cannot be reported as a 35% increase in rate. That would mix an energy difference with a relative rate. Quantitative predictions need an appropriate kinetic model and temperature data, which belong to the later A Level rates section. Here, distinguish mechanism-based explanation from an unsupported multiplier.
To evaluate a proposed rate improvement, hold other variables constant and define what is measured. A powder can expose more reactive surface than a lump, but the particles still need a viable reaction route. A catalyst can speed progress without increasing the final equilibrium yield in a closed mixture. A pressure intervention can alter both encounters and equilibrium when gases are involved, so a faster early rate is not proof of a larger final yield. The illustration should be read as a carefully supplied energy account; it cannot identify a real catalyst or justify handling an unfamiliar chemical without a supervised risk assessment.
Worked example: A supplied single-step profile has reactants at 0 and products at −20 kJ mol⁻¹. Its uncatalysed peak is +60 and alternative-path peak is +25. Find all four barriers and ΔH.
Forward uncatalysed barrier: 60 − 0 = 60 kJ mol⁻¹.
Reverse uncatalysed barrier: 60 − (−20) = 80 kJ mol⁻¹.
Forward alternative barrier: 25 − 0 = 25 kJ mol⁻¹.
Reverse alternative barrier: 25 − (−20) = 45 kJ mol⁻¹.
Endpoint difference remains −20 − 0 = −20 kJ mol⁻¹. Both barriers fall by 35, while the equilibrium energy difference is unchanged.
Answer: Forward/reverse barriers are 60/80 without the catalyst and 25/45 kJ mol⁻¹ with it; ΔH stays −20 kJ mol⁻¹. No numerical rate factor follows from these energies alone.
Check your understanding: A different supplied profile has reactants at 0, products at +15 and a peak at +70 kJ mol⁻¹. An alternative peak is +35. Find the reverse barriers and judge the claim that catalysis makes the forward reaction exothermic.
Answer: Original reverse barrier = 70 − 15 = 55 kJ mol⁻¹; alternative reverse barrier = 35 − 15 = 20 kJ mol⁻¹. Forward barriers are 70 and 35. The products remain 15 kJ mol⁻¹ above reactants, so ΔH remains +15 and the supplied forward process remains endothermic. A catalyst lowers both barriers without moving the endpoints; the numerical rate change cannot be calculated from this diagram alone. The two barriers each decrease by 35 kJ mol⁻¹, preserving the 15 kJ mol⁻¹ difference between the same endpoints.
Why: Use the stated equation, conservation account, units and representation limits. Supplied illustrative reasoning is not observed practical performance, completed formal assessment or evidence of mastery.