Coherence turns two sources into a stable pattern
By UK A Level Physics · independent study · myAudience
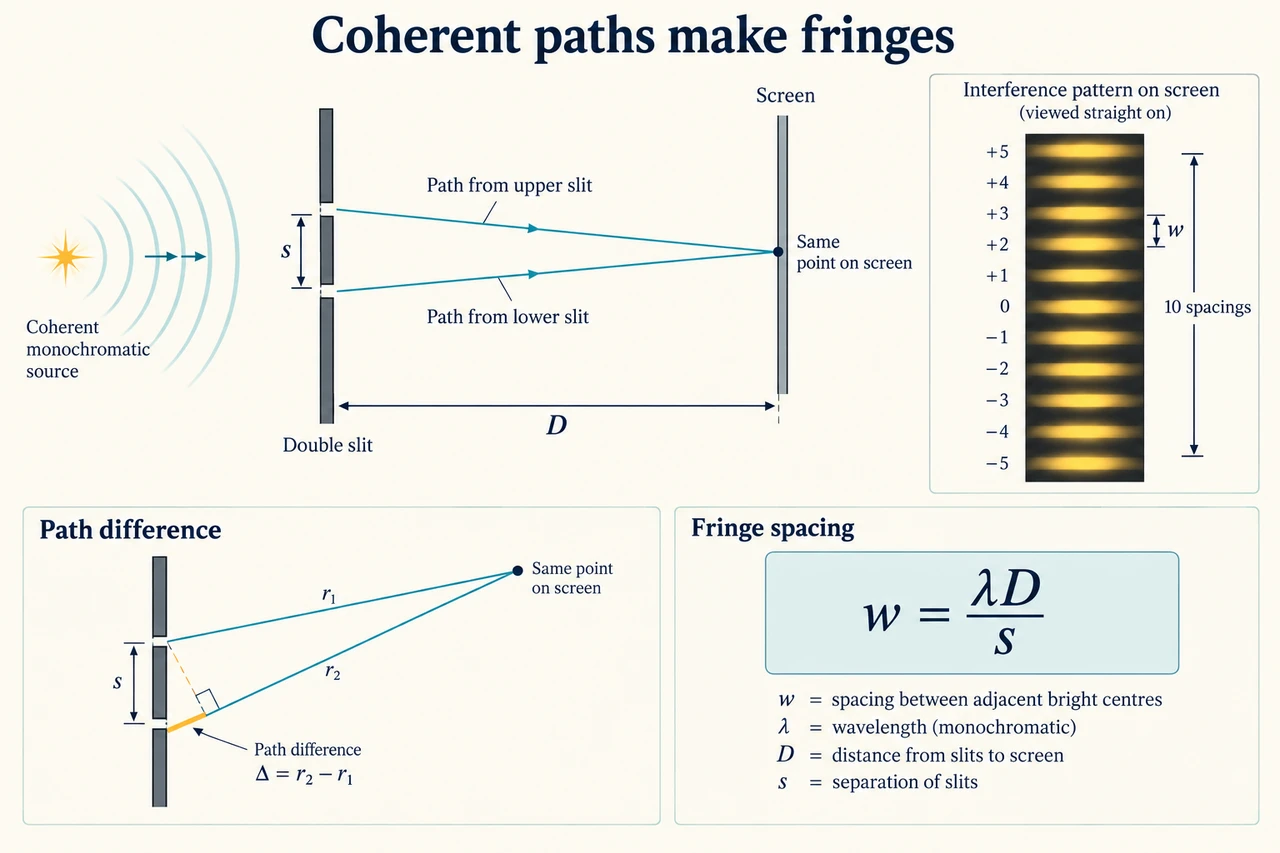
Image: illustration, not a documentary photograph. Coherent two-source waves produce interference through path difference, with a separate far-field fringe geometry. · Operator-authored generated illustration; scientific model and source limits reviewed separately.
Coherence turns two sources into a stable pattern
Two waves arriving at one place contribute to the same displacement or field. When their contributions reinforce, the combined amplitude is larger; when they oppose, it is smaller and can vanish in an ideal equal-amplitude case. The result depends on phase, not on whether two rays cross on a drawing. For a stable interference pattern the sources must maintain a constant phase difference and the same frequency: they must be coherent. Two ordinary independent lamps can emit similar colours without keeping that relation. Their rapidly changing relative phase washes out a stable set of bright and dark bands when the detector averages many fluctuations.
A single source illuminating two narrow slits gives the outgoing waves a shared phase relationship. At a chosen point on a distant screen, the two paths are generally unequal. For initially in-phase sources, a path difference of an integer number of wavelengths gives reinforcement; an odd half-wavelength gives cancellation when amplitudes match. If the sources begin with a different phase relation, that phase must be added to the path-induced difference. The familiar bright-centre condition is therefore conditional, not a universal rule that every pair of sources has its brightest point at equal path length.
The geometry connects path difference to position on the screen. Let slit separation be s, distance from slit plane to screen be D and displacement from the central line on that screen be y. At sufficiently small angles, the path difference is approximately s y/D. A change of one wavelength between successive bright centres therefore requires a change in y of λD/s. We call that separation w. The derivation assumes the screen is far away relative to s, its useful region is close enough to the central axis for the small-angle approximation, and the geometry has not changed during the observation. Use metres consistently before substituting.
Measuring across several fringes can reduce the relative effect of an endpoint-reading uncertainty. Count intervals between centres, not the number of bright marks. Eleven consecutive bright centres contain ten spacings; dividing their span by eleven would systematically underestimate w. Identify the chosen centres and any repeated reading strategy. A wider measured span does not remove a wrong ruler scale, a misidentified centre or uncertainty in D and s. These enter a derived wavelength through different parts of the model. Our worked observation is synthetic and gives exact teaching values for D and s so the stated uncertainty calculation has a clear, limited meaning.
White light contains a range of wavelengths. At zero path difference, its components reinforce together for the specified in-phase arrangement, producing a central white fringe. Away from the centre, different wavelengths reinforce at different positions, so the first surrounding fringes show colour separation and farther fringes overlap. This is not a grating's set of well-separated spectra simply reproduced by two slits. A monochromatic source produces a simpler pattern, while a finite slit width also adds a diffraction envelope. A dark region might therefore need both interference and aperture reasoning; the fringe-spacing expression alone does not describe every intensity feature.
The same path and phase reasoning applies to sound and electromagnetic waves. For sound, two coherent speakers can create positions of stronger and weaker response; at a given frequency, wavelength follows the sound speed in the medium. A microphone measures a pressure-related signal rather than directly drawing air-molecule displacement. For microwaves, orientation and detector response can affect the recorded signal as well as the path geometry. Two unequal source amplitudes cannot cancel completely even at an opposing phase. A local minimum is evidence consistent with interference, but uncontrolled source strength, reflections and background can also alter the observed pattern.
Interference supports a wave account because superposition and phase explain organised reinforcement and cancellation. It should be considered alongside other evidence: the earlier photoelectric lesson requires quantised photon-energy transfer, so one observation does not settle every property of light. A useful scientific explanation predicts how changing wavelength, slit separation or screen distance changes the pattern and then states which variables were controlled. The worked transfer deliberately changes several variables to make a wavelength-only argument fail. A correct conclusion must connect the cause to the measured quantity, rather than merely describe light as wave-like.
This practical study includes Young's slit experiment and diffraction-grating interference. This lesson prepares the slit part through geometry, controls, fringe counting and uncertainty; the next lesson treats the grating relation. Real laser work needs the supervised risk assessment and safe apparatus arrangements appropriate to the source. We give no instructions to improvise a beam alignment or operate an unspecified laser. The illustration's rays and screen inset explain the arrangement; their lengths and band spacing are not calibrated measurements. The synthetic observation below establishes arithmetic under stated assumptions, not practical completion, instrument competence or an assessed examination result.
Worked example: Use 600 nm light, slit separation 0.50 mm and screen distance 2.0 m to predict fringe spacing. A synthetic observation across eight spacings is 19.2 ± 0.4 mm. Treat D and s as exact teaching values and infer wavelength and its illustrative uncertainty. Explain how to count the intervals.
Convert λ = 600 × 10⁻⁹ m and s = 0.50 × 10⁻³ m. D is already 2.0 m. Keep slit separation s distinct from the observed screen span; replacing one by the other would assign the wrong geometry to the equation.
Calculate w = λD/s = (600 × 10⁻⁹ × 2.0)/(0.50 × 10⁻³) = 0.0024 m = 2.4 mm. The relevant angles are small for these dimensions, so the near-axis relation used to derive this spacing is consistent with the example.
Eight spacings require nine selected consecutive centres. Divide the supplied span by eight:19.2/8 = 2.4 mm. A different diagram showing eleven centres would contain ten spacings, not eleven. Count the gaps between the chosen marks rather than the marks themselves.
Recover wavelength by rearranging λ = ws/D. Using w = 0.0024 m gives λ = 0.0024 × 0.00050/2.0 = 6.00 × 10⁻⁷ m. This matches the supplied 600 nm and checks both the unit conversion and the interval interpretation.
The span's relative uncertainty is 0.4/19.2 = 1/48, about 2.0833%. Dividing by an exact count leaves that relative uncertainty unchanged. With exact D and s, λ has the same illustrative relative uncertainty, giving an absolute bound 600/48 = 12.5 nm.
Report the unrounded model result as 600 ± 12.5 nm, or a sensibly rounded bound such as 600 ± 13 nm with the convention stated. This is a supplied bound propagated through a teaching model, not a statistical confidence interval. Real uncertainty in D or s and misidentified centres would require additional reasoning.
Answer: Predicted fringe spacing 2.4 mm; inferred wavelength 600 nm with illustrative first-order bound 12.5 nm before rounding. Nine centres enclose eight spacings.
Check your understanding: Change to 450 nm light, D = 1.5 m and s = 0.75 mm. A learner multiplies the old spacing by 450/600 and predicts 1.8 mm. Find the correct spacing and diagnose the omission. Separately, coherent speakers emit 680 Hz sound at 340 m/s: when will a 0.25 m path difference give complete cancellation?
Answer: The correct spacing is (450 × 10⁻⁹ × 1.5)/(0.75 × 10⁻³) = 0.00090 m = 0.90 mm. Relative to the old arrangement, wavelength contributes a factor 0.75, screen distance 0.75 and inverse slit separation 2/3; their product is 0.375, giving 2.4 × 0.375 = 0.90 mm. The 1.8 mm prediction keeps geometry fixed even though both D and s changed. Sound wavelength is 340/680 = 0.50 m, so 0.25 m is half a wavelength. That path-induced half-cycle opposition gives complete cancellation only if the sources begin in phase and arrive with equal amplitudes under the stated simple model. If the sources start in antiphase, the same extra half-cycle can instead make their contributions reinforce.
Why: Track every changed factor in the geometry and include initial phase and amplitude when interpreting path difference. A half-wavelength is not an unconditional instruction to declare silence.