Signed graphs and independent components describe one trajectory
By UK A Level Physics · independent study · myAudience
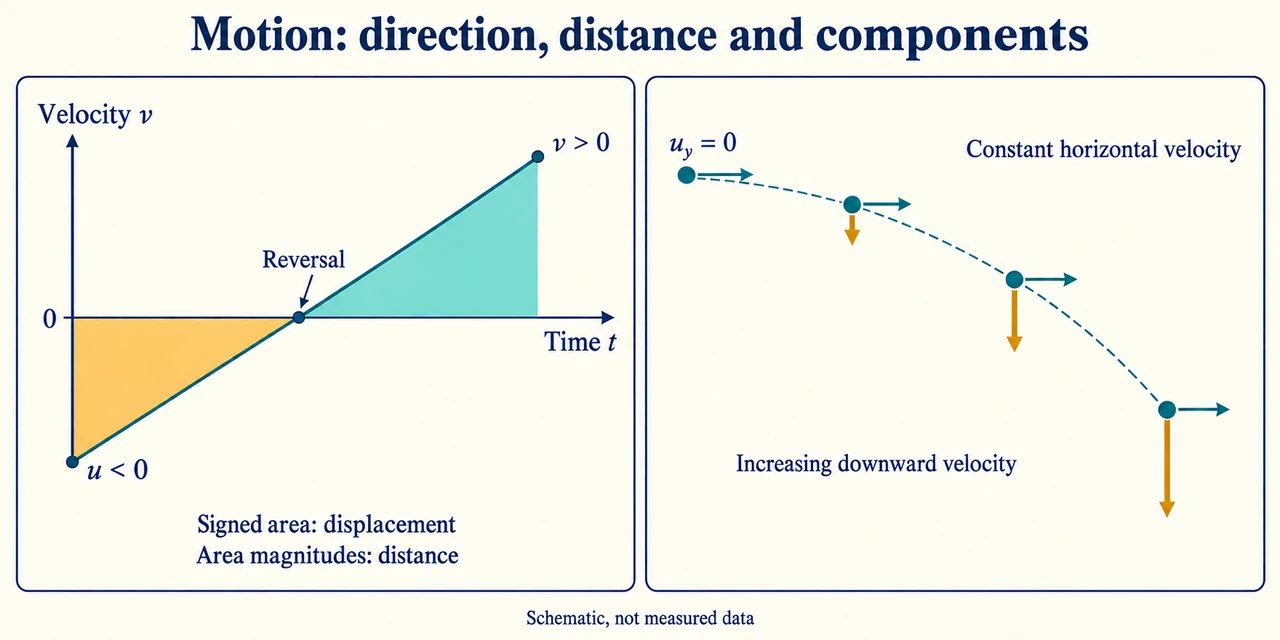
Image: illustration, not a documentary photograph. Signed velocity–time area gives displacement; projectile velocity has independent horizontal and vertical components. · Operator-authored generated illustration; scientific model and source limits reviewed separately.
Signed graphs and independent components describe one trajectory
Distance counts how much path an object covers; displacement records the change in position relative to an origin and chosen direction. They differ when motion reverses. Average velocity is total displacement divided by elapsed time, while average speed uses distance. A journey out and back can have zero average velocity and positive average speed without any period of rest. Instantaneous velocity describes the motion at one time, represented by the gradient of a displacement–time graph at that point. Acceleration is the rate of change of velocity, so its sign tells us how velocity changes on the chosen axis, not whether the object is automatically speeding up.
Graph axes determine the meaning of a slope or an area. The gradient of displacement against time gives velocity; the gradient of velocity against time gives acceleration. The signed area under a velocity–time graph gives displacement, while adding the magnitudes of negative and positive contributions gives distance. Area under acceleration against time gives change in velocity, not displacement. For a curved displacement graph, use a tangent to estimate instantaneous velocity and a secant over an interval for average velocity. A straight line on one kind of graph is not interchangeable with a straight line on another. Always include the units that follow from the axes.
Constant acceleration leads to v = u + at. The velocity–time area then gives s = (u + v)t/2; substituting v yields s = ut + at²/2. Eliminating time gives v² = u² + 2 as. These are four descriptions of the same constant-acceleration model, not four independent forces. Use signed u, v, a and s with one consistent axis. The squared-velocity relation loses the sign of v, so a square root needs the direction established separately. For arbitrary changing acceleration, substituting an average value into every relation is not generally valid; graph areas, gradients or a properly specified piecewise model are needed.
A bounce helps separate these descriptions. Choose upwards as positive: a falling ball has negative velocity and approximately negative acceleration before contact, then changes velocity rapidly while the floor exerts a large contact force. The velocity graph can cross from negative to positive during contact. Gravity has not suddenly changed sign, and the short contact interval is not free fall with acceleration −g alone. A synthetic graph crossing zero can therefore describe reversal rather than a long stop. Interpreting its signed areas also prevents a return towards the origin from being counted as negative distance travelled.
Free fall near Earth's surface is modelled with a nearly uniform downward gravitational acceleration g when other forces are negligible. An investigation might release an object from rest and use known heights with measured times, expecting h = gt²/2. A plot of h against t² has slope g/2 under those assumptions. Timing offsets, a nonzero release speed and drag can alter the result; repeats help examine random variation but do not automatically remove a shared delay or wrong height origin. Methods and calibrated data are required to assess uncertainty. Our given value 9.8 m/s² is a teaching input, not a measurement of local g or completion of the practical study.
Projectile motion separates horizontal and vertical components under a uniform gravitational field. In the no-drag model the horizontal acceleration is zero and the vertical acceleration is −g for an upward-positive axis. They share the same time variable but have different initial conditions. A horizontal launch has initial vertical velocity zero, not zero total velocity. The vertical height equation determines flight time to a specified level; horizontal speed then determines horizontal range. A sloping launch needs its initial velocity resolved into both components. A different landing height changes the vertical equation and may make a familiar same-height range expression inapplicable.
Real motion can involve friction, lift and drag. Drag increases with speed in the qualitative model and opposes motion relative to the fluid. A falling object can approach terminal speed when upward drag balances weight: velocity is then nonzero while acceleration is zero. Lift can change the direction of a flight, so the simple ballistic parabola is not universal. Air resistance generally reduces a simple projectile's horizontal reach and changes its trajectory, but its detailed effect requires a force model and initial conditions. We do not invent a numerical drag law or demand a static/dynamic-friction distinction that is outside the specified tested treatment.
Our illustration separates a signed velocity–time graph from an equal-time projectile drawing. In the latter, constant horizontal velocity gives equal horizontal gaps while vertical drops grow under acceleration. Arrow lengths show components schematically; they are not measured speeds. The worked graph and projectile happen to share a 16 m numerical result, which does not make their causes the same. A sound answer names the origin, signs, model and quantity calculated, then checks where those assumptions could fail. Synthetic arithmetic, a generated curve and method reasoning do not establish actual apparatus use, safe experimental performance, assessed mastery or a complete qualification.
Worked example: A synthetic velocity–time line begins at −2 m/s and has constant acceleration+3 m/s² for 4 s. Find final velocity, displacement and distance. Separately a projectile launches horizontally at 8 m/s from a platform 19.6 m above its landing level; use g = 9.8 m/s² and ignore drag. Find its flight time, range and final velocity components.
For the graph choose the shown positive direction. Final velocity is v = −2 + 3 × 4 = +10 m/s. Zero velocity occurs at t = 2/3 s, so motion reverses within the interval. Constant positive acceleration initially reduces the magnitude of the negative velocity before increasing positive speed.
Signed displacement is the trapezium area: s = (−2 + 10) × 4/2 = 16 m. Equivalently s = −2 × 4 + 3 × 4²/2 = 16 m. The agreement checks the constant-acceleration relationship but does not mean all the path was travelled in the positive direction.
The negative triangular area has magnitude(1/2) × (2/3) × 2 = 2/3 m. The positive area is (1/2) × (4 − 2/3) × 10 = 50/3 m. Distance adds both magnitudes, giving 52/3 m ≈ 17.333 m; displacement subtracts them, giving 48/3 = 16 m.
For the separate projectile set the launch point as y = 0 and upwards positive. Initial vertical velocity is zero and landing displacement is −19.6 m. Thus −19.6 = −9.8 t²/2; the physical positive-time solution is t = 2.0 s. The horizontal 8 m/s does not enter that vertical equation.
With horizontal acceleration zero, range is x = 8 × 2 = 16 m. Final horizontal velocity stays+8 m/s, while vertical velocity is vy = −9.8 × 2 = −19.6 m/s. Both components describe the same landing instant, rather than two independent flight times.
The final speed is √(8² + 19.6²) ≈ 21.1698 m/s; its direction is downwards and rightwards, at arctan(19.6/8) below the horizontal. The graph's 16 m displacement and projectile's 16 m range came from different inputs and assumptions, so one cannot be used as evidence for the other.
Answer: Graph: final+10 m/s, displacement+16 m, distance 52/3 m. Projectile: flight 2.0 s, horizontal range 16 m, final components(+8,−19.6) m/s and speed≈21.17 m/s.
Check your understanding: A new graph has u = +4 m/s, a = −2 m/s² and duration 4 s. Explain why zero net displacement does not imply no motion. Separately launch horizontally at 12 m/s from 4.9 m above the landing level under the same ideal gravity. Find time, range and final speed. Would replacing the speed by 24 m/s at that height halve the ideal time?
Answer: The graph ends at v = 4 − 2 × 4 = −4 m/s and crosses zero at 2 s. Displacement is 4 × 4 − 2 × 4²/2 = 0, but each triangular velocity area has magnitude 4 m, so distance is 8 m. Average velocity is zero, whereas average speed is 8/4 = 2 m/s. For the projectile,4.9 = 9.8 t²/2 gives t = 1.0 s. Range is 12 m, final components are (+12,−9.8) m/s and speed is √(12² + 9.8²) ≈ 15.4932 m/s. Changing only horizontal speed to 24 m/s doubles ideal range to 24 m but leaves time 1.0 s; the vertical initial conditions and landing level are unchanged. With drag, lift or altered landing geometry, component independence and that simple prediction must be reconsidered.
Why: Signed area and total path answer different questions. Component independence uses shared time with separate initial conditions; it is a stated model, not a rule for every real flight.