Read a titration curve from the matter balance
By UK A Level Chemistry · independent study · myAudience
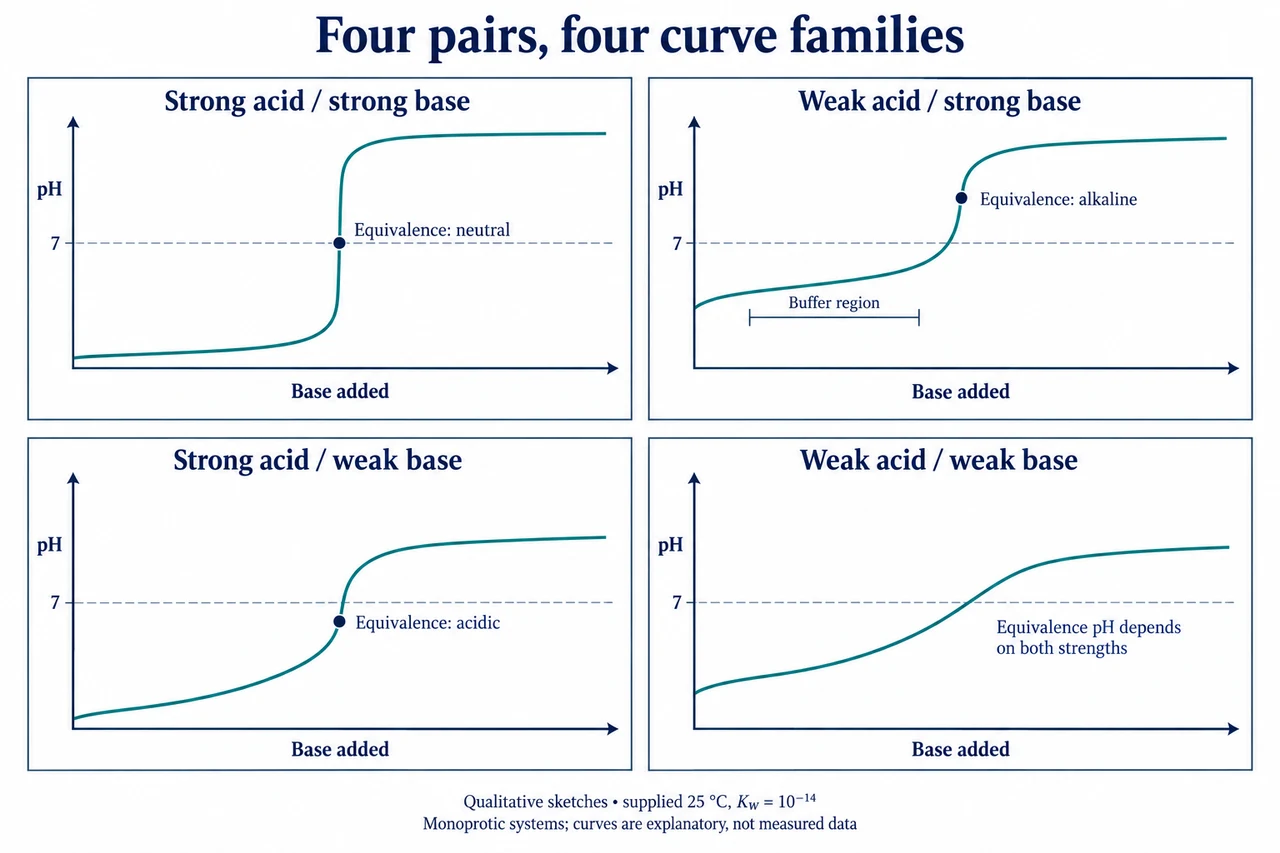
Image: illustration, not a documentary photograph. Four qualitative acid-analyte/base-titrant curve families use the supplied 25 °C and Kw convention. The neutral reference distinguishes three equivalence regimes; weak/weak equivalence depends on both strengths. Curves are explanatory, not measured data or fitted numerical traces. · Original AI-generated illustration; independently reviewed scientific teaching model.
Read a titration curve from the matter balance
A titration curve connects a sequence of chemical states, not merely a smooth line between acidic and alkaline endpoints. Its horizontal axis records the volume of a specified titrant added, and its vertical axis records pH. Start by identifying the initial analyte, the titrant, their concentrations and the balanced reaction. Here we compare monoprotic acid–base systems at a supplied temperature of 25 °C with Kw = 1.00 × 10⁻¹⁴ in the dilute concentration model. These conditions matter: changing temperature, concentrations or acid strength changes the curve and can move its important pH values.
Before equivalence in a strong-acid/strong-base titration, added hydroxide consumes hydrogen ions. For 25.00 cm³ of 0.1000 mol dm−3 acid, the initial amount is 0.002500 mol. Adding 20.00 cm³ of 0.1000 mol dm−3 hydroxide supplies 0.002000 mol, leaving 0.0005000 mol excess hydrogen ions in a total volume of 0.04500 dm³. Thus [H+] ≈ 0.0111111 mol dm−3 and pH ≈ 1.95424. Use excess amount divided by the new total volume; subtracting concentrations directly loses both the original aliquot and the dilution caused by titrant.
At equivalence the reactants have been combined in the stoichiometric proportion required by the balanced equation. In this example that occurs at 25.00 cm³ of base because both solutions have the same concentration and the ratio is 1:1. With a strong monoprotic acid and strong base, neglecting salt activity effects, hydrogen and hydroxide concentrations are equal at equivalence. The supplied Kw then gives pH 7.00. Equivalence is fundamentally an amount relationship, however, rather than a universal synonym for pH 7; a different acid–base pair can reach equivalence at a different pH.
After equivalence, excess hydroxide controls the strong-acid/strong-base approximation. At 30.00 cm³ added base, the excess amount is 0.003000 − 0.002500 = 0.0005000 mol in 0.05500 dm³. This gives [OH−] ≈ 0.00909091 mol dm−3; calculate [H+] = Kw/[OH−] before finding pH ≈ 11.95861. The steep central region develops because the identity of the substantial excess changes across equivalence. Close enough to that region, water and small residual amounts matter, so the simple excess-concentration shortcuts should not be applied exactly where their denominator predicts zero concentration.
A weak-acid/strong-base curve begins at a higher pH than a comparable strong-acid curve because the weak acid dissociates only partly. Added base produces its conjugate base, creating a buffer region while appreciable HA and A− remain. At half-neutralisation their analytical amounts are equal, and the usual buffer approximation gives pH ≈ pKa. For Ka = 1.80 × 10⁻⁵, that value is 4.74473. At equivalence the solution contains the conjugate base, which reacts with water to generate hydroxide; equivalence is therefore alkaline under these conditions. The relevant shape follows the chemistry of the remaining species, not an arbitrary bend added by the illustrator.
In a strong-acid/weak-base titration the initially strong acid is consumed by a base that does not supply hydroxide as completely as a strong base. At equivalence its conjugate acid can donate protons to water, producing an acidic equivalence region. A weak-acid/weak-base titration generally has a much less distinct pH jump; its equivalence pH depends on the relative acid and base strengths and is not determined by the word weak alone. All four families must therefore be distinguished. The numerical calculations above belong to the strong/strong case; the qualitative weak-system explanations do not pretend to replace a full coupled-equilibrium solution.
Read the four-panel illustration with the same acid-analyte/base-titrant orientation throughout. All four curves are qualitative sketches under the stated conditions, not experimental traces or fitted equations; no concentration or delivered-volume measurement should be inferred from their smoothness. The strong/strong equivalence marker lies on the supplied neutral reference, while weak-acid/strong-base and strong-acid/weak-base markers lie on opposite sides. The weak/weak panel deliberately assigns no universal equivalence pH. The numerical landmarks calculated in the lesson are separate model results, not points extracted from this sketch. When conditions differ, reconstruct the amount balance and identify the remaining species before borrowing either a landmark or an indicator choice from a familiar curve.
Worked example: At 25 °C, titrate 25.00 cm³ of 0.1000 mol dm−3 fully dissociated monoprotic acid with 0.1000 mol dm−3 strong hydroxide. With Kw = 1.00 × 10⁻¹⁴, calculate approximate pH at 20.00,25.00 and 30.00 cm³ added, stating each model.
Initial acid amount = 0.02500 × 0.1000 = 0.002500 mol; the 1:1 equivalence volume is 0.002500/0.1000 = 0.02500 dm³.
At 20.00 cm³, remaining H+ amount =0.002500−0.002000=0.0005000 mol; divide by 0.04500 dm³ to obtain 0.0111111 mol dm−3 and pH 1.9542425.
At 25.00 cm³, no stoichiometric excess remains. For this ideal strong/strong salt system use [H+] = sqrt(Kw)=1.00 ×10⁻⁷ mol dm−3, giving pH 7.00.
At 30.00 cm³, excess OH− = 0.0005000 mol in 0.05500 dm³, so [OH−] = 0.009090909 mol dm−3,[H+] = 1.10 ×10⁻¹² mol dm−3 and pH 11.9586073.
Answer: The approximate pH values are 1.95424,7.00 and 11.95861. The first and last use dominant stoichiometric excess; equivalence instead uses the water product and the stipulated ideal strong/strong salt conditions.
Check your understanding: Replace the acid with a weak monoprotic acid having Ka =1.80 ×10⁻⁵ but keep its amount and both concentrations unchanged. Where is half-neutralisation, what is its approximate pH, and why is equivalence no longer at 7?
Answer: The 1:1 equivalence volume remains 25.00 cm³ because the initial acid amount is unchanged. Half-neutralisation is 12.50 cm³. There, equal remaining HA and generated A− amounts give pH ≈ pKa = −log10(1.80 ×10⁻⁵)=4.74473 under the buffer approximation. At 25.00 cm³ the conjugate base is the main acid-derived species; its reaction with water producesOH−, making equivalence alkaline under the stipulated conditions. This qualitative conclusion is not a numerical solution for the full equivalence equilibrium.
Why: Original independently checked transfer reasoning under stated concentration, temperature and finite-inventory limits. Editorial review is not assessed mastery, observed practical performance or a completed practical endorsement.