Separate the endpoint from equivalence
By UK A Level Chemistry · independent study · myAudience
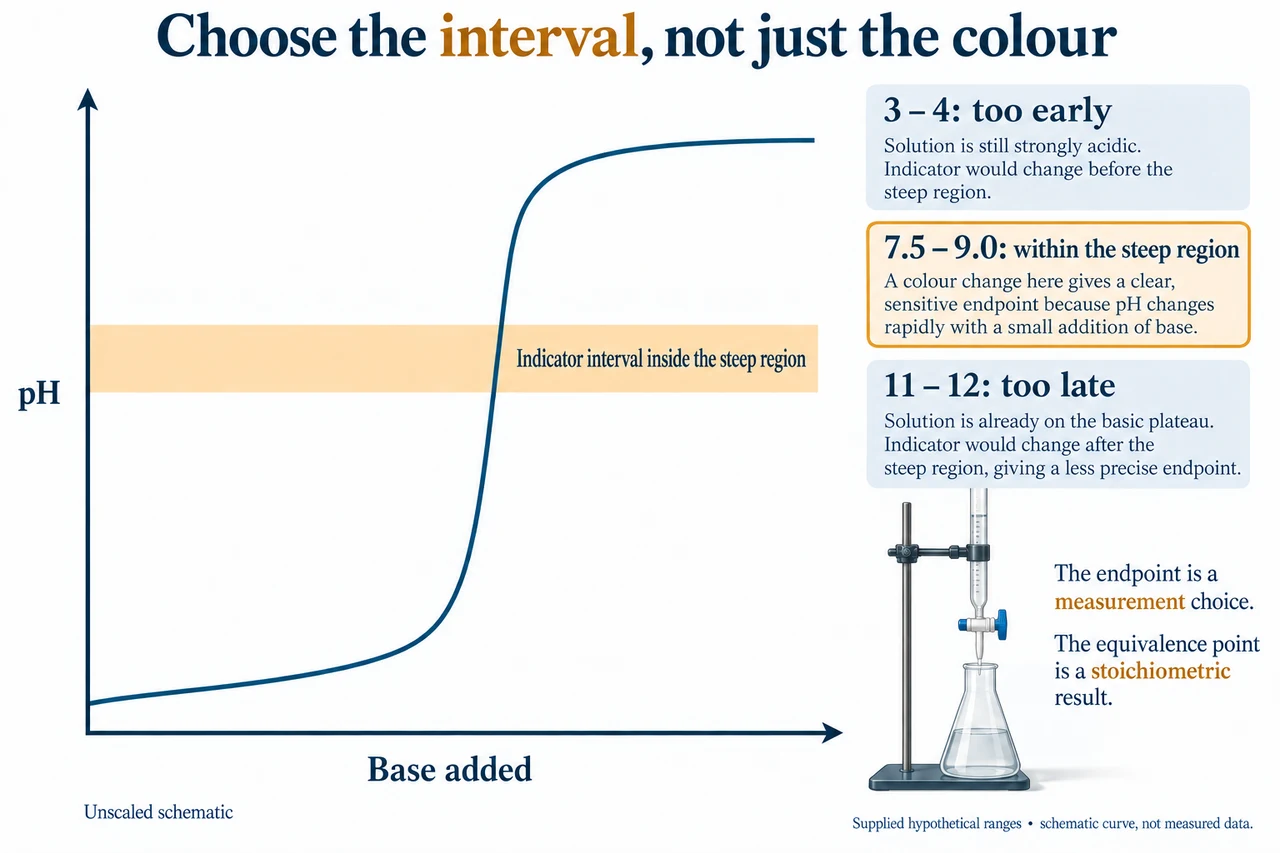
Image: illustration, not a documentary photograph. The unscaled schematic places an indicator interval within a steep region. The separate supplied hypothetical ranges are teaching data, not real named indicator specifications; the curve is not a numerical fit or measured trace. Apparatus is explanatory, not a performed-practical record. · Original AI-generated illustration; independently reviewed scientific teaching model.
Separate the endpoint from equivalence
A visible endpoint and chemical equivalence answer related but different questions. Equivalence is the stoichiometric condition at which the intended reactants have combined in the balanced ratio. An indicator endpoint is the observed colour criterion chosen to stop adding titrant. A suitable indicator changes over a pH interval lying within the rapid pH change around equivalence, so a small added volume carries the solution through that interval. Choosing an indicator because its colour is attractive, or because its transition contains pH 7, ignores the actual curve and can produce a systematic error in the inferred concentration.
Use the supplied curve, not a guessed transition range. Suppose its steep portion spans approximately pH 7–10, and three hypothetical indicators have intervals of pH 3–4,7.5–9.0 and 11–12. The middle interval is the suitable candidate because it lies inside the supplied steep region. The first would change too early and the third too late under this orientation. These intervals are teaching data, not attributed specifications for named commercial indicators. Where both acid and base are weak and the pH change is gradual, even a plausible colour interval may correspond to a substantial volume uncertainty; a calibrated pH probe can help locate the curve rather than manufacture a sharper endpoint.
The concentration result begins with the titre, the difference between final and initial burette readings, not automatically the final reading alone. Record consistent reading precision, view the meniscus appropriately for the liquid and apparatus, and distinguish an exploratory rough run from measurements intended for analysis. Rinsing with the solution subsequently held reduces unintended dilution, while a filled tip and an absence of trapped air help connect the measured delivered volume to the amount that actually reaches the flask. These are reasons behind practical technique, not evidence that a reader has performed the required practical or acquired its competencies.
Consider an original fictional dataset of 24.80,24.85 and 26.10 cm³, with the notebook explicitly recording that the last run overshot the intended endpoint. That documented event justifies excluding 26.10 from this worked estimate; it does not license discarding any result simply because it is inconvenient. The two retained titres average 24.825 cm³. If 0.1000 mol dm−3 base reacts 1:1 with a 25.00 cm³ acid aliquot, the acid concentration is 0.1000 ×0.024825/0.02500=0.09930 mol dm−3. The dataset demonstrates reasoning about a known problem, not a universal concordance rule or borrowed examination answer.
Uncertainty does not disappear when readings agree. If each of the two burette readings has a supplied worst-case uncertainty of ±0.05 cm³, their difference has a worst-case bound of ±0.10 cm³ by adding magnitudes. Relative to 24.825 cm³ that is approximately 0.40282%. This conservative bound is not the same as a statistical standard uncertainty, and it covers only the stipulated burette contribution. The aliquot volume, standard solution concentration, endpoint judgement and any systematic bias also affect the inferred acid concentration. Averages can reduce some random variation while leaving common calibration and endpoint errors intact.
A pH probe also needs a measurement plan. Calibrate using suitable standards that bracket the intended measurement range where practical, follow the instrument's instructions, account for temperature, and avoid carrying contamination from one liquid into the next. Collect more closely spaced added-volume points where the curve changes rapidly; a coarse interval can skip the feature being used to locate equivalence. A probe trace provides measured pH as a function of delivered volume, not direct permission to equate its largest displayed pH with the required endpoint. Interpretation still requires the reaction, amount balance and limitations of the recorded data.
the practical study concerns investigating pH changes when a weak acid reacts with a strong base and when a strong acid reacts with a weak base. This lesson supports the reasoning behind that investigation; performed practical status remains OPEN. Handle solutions and apparatus only within appropriate supervised procedures and risk assessment, rather than treating an illustration as an independent laboratory instruction. The figure contrasts the stoichiometric reference with one hypothetical colour interval on a schematic curve. Its apparatus details are explanatory, and neither its shape nor the fictional readings establish a completed experiment or an uncertainty budget for a real laboratory.
Worked example: For a fictional 1:1 titration use 0.1000 mol dm−3 base and 25.00 cm³ acid. Titres are 24.80,24.85 and 26.10 cm³; the last has a documented overshoot. Calculate concentration from the retained results and the burette-only worst-case relative uncertainty when each reading is ± 0.05 cm³.
The explicit overshoot record excludes 26.10 from this estimate; retained mean=(24.80+24.85)/2=24.825 cm³.
Amount base=0.1000 ×0.024825=0.0024825 mol; 1:1 stoichiometry gives the same acid amount.
Acid concentration=0.0024825/0.02500=0.09930 mol dm−3.
Two reading bounds add to ± 0.10 cm³; burette-only relative bound=0.10/24.825 ×100=0.4028197%. Other contributions remain unquantified.
Answer: The calculated concentration is 0.09930 mol dm−3, with a stipulated burette-only worst-case relative bound of about 0.403%. Agreement of the retained readings does not prove absence of systematic bias, and the overshoot exclusion is supported by a recorded cause.
Check your understanding: A supplied curve has a steep interval from pH 7 to 10. Choose among hypothetical indicator intervals 3–4,7.5–9.0 and 11–12. Would the same colour method necessarily work well for a gradual weak/weak curve?
Answer: The 7.5–9.0 interval lies within the specified steep portion and is the suitable candidate. The 3–4 interval lies before it and 11–12 after it under the stated acid-analyte/base-titrant orientation. On a gradual weak/weak curve a colour interval can span appreciable delivered volume, so this choice does not guarantee a precise equivalence estimate; collect calibrated probe data and assess the curve and model instead. No real named indicator range has been claimed.
Why: Original independently checked transfer reasoning under stated concentration, temperature and finite-inventory limits. Editorial review is not assessed mastery, observed practical performance or a completed practical endorsement.