A rate belongs to an interval or a moment
By UK GCSE Chemistry · independent study · myAudience
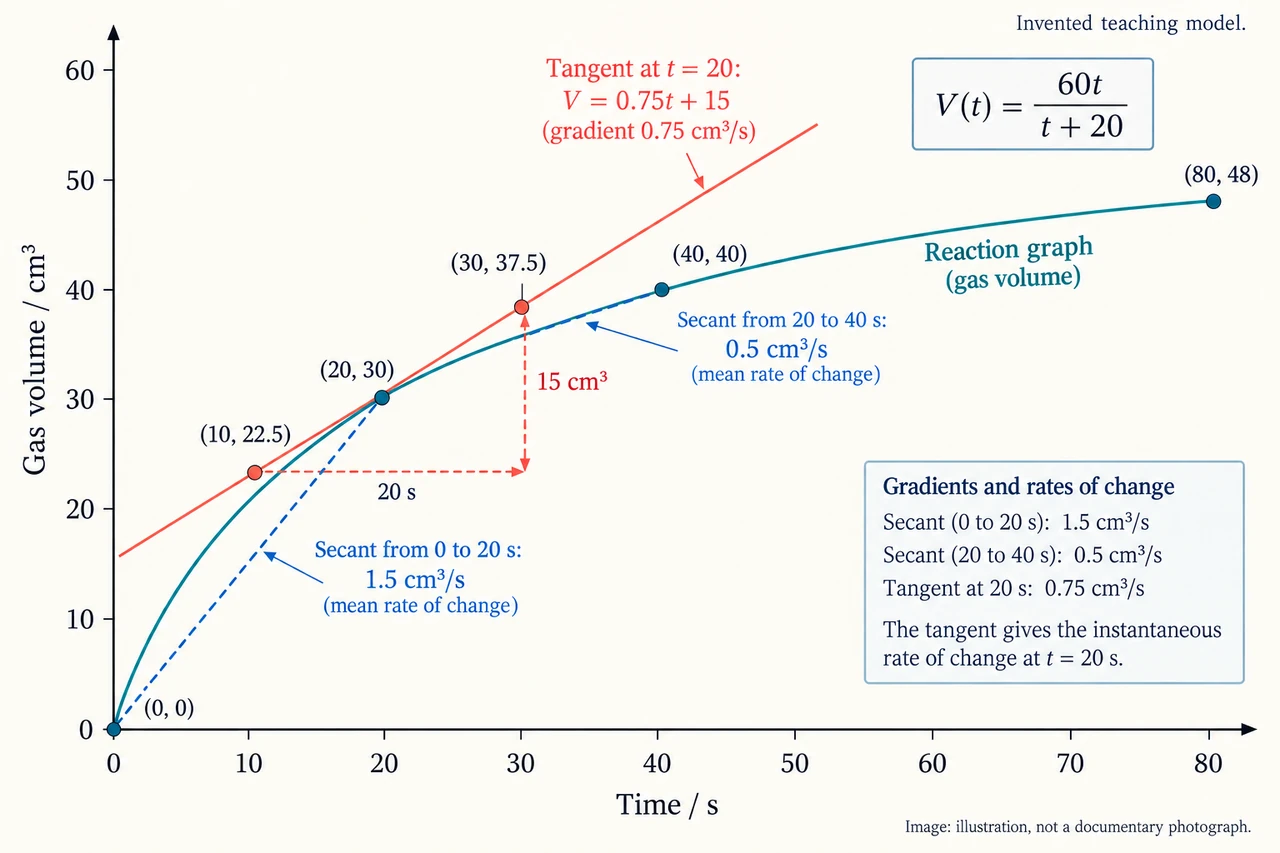
Image: illustration, not a documentary photograph. This invented cumulative graph uses V(t) = 60t/(t + 20) cm³ over 0 ≤ t ≤ 80 s. The secants measure interval means; the tangent at 20 s has gradient 0.75 cm³/s and intercept 15 cm³. Its triangle vertices are points on the tangent, not measured curve readings. Numerical tangent calculation is Higher-tier content. Formula and stated coordinates control the example; the diagram is schematic, and a small preview supports recognition rather than reliable reading of coordinates or labels. No exact completion or experimental measurement is claimed. · Original generated myAudience illustration; not a documentary photograph.
A rate belongs to an interval or a moment
A quantity tells us how much has changed; a rate tells us how quickly it changes. Collecting 30 cm³ of gas is a quantity, not a rate. To find a mean rate, divide the amount formed during a specified interval by the duration of that interval. The interval matters: the same reaction can run quickly at first and more slowly later. Always identify the measured quantity, its unit and the two times before choosing numbers for a calculation.
A cumulative product graph starts from an initial reading and records the total collected so far. Its height at 40 s is not the amount formed between 20 s and 40 s. Subtract the earlier reading from the later one. On our invented graph, volumes at 0, 20 and 40 s are 0, 30 and 40 cm³. The first interval therefore produces 30 cm³ in 20 s, whereas the second produces only 10 cm³ in 20 s. Their mean rates are 1.5 and 0.5 cm³/s respectively.
On a product-versus-time graph, the mean rate over an interval is the gradient of the straight line joining its endpoint readings. A steeper upward line indicates faster formation. If instead a graph shows the quantity of reactant remaining, its downward gradient describes depletion. The positive consumption rate uses the amount lost, rather than calling a falling reading a negative quantity consumed. A flattening product graph means less additional product is appearing per second; its existing height does not suddenly disappear.
A rate at one instant uses the direction of the curve there, represented by a tangent. The tangent touches the curve locally and is not the line joining two widely separated reaction readings. Drawing and interpreting tangents belongs to the shared topic; calculating a tangent gradient numerically is a Higher-tier extension. At 20 s, our constructed tangent passes through (10 s, 22.5 cm³) and (30 s, 37.5 cm³). Its gradient is 15 cm³ divided by 20 s, or 0.75 cm³/s. These are points on the tangent, not two additional observations on the reaction curve.
A useful tangent triangle uses points far enough apart to read reliably, while following that same straight tangent. Starting a triangle at the graph origin is valid only if the tangent actually passes through the origin. Here it does not: its extrapolated intercept is 15 cm³. This is not a claim that 15 cm³ was collected at the start. The reaction graph itself starts at zero. Confusing the extended tangent with the reaction curve would turn a local estimate into a false observation.
The units follow the measured quantity. A mass-based mean of 0.72 g consumed over 90 s is 0.008 g/s. A volume-based rate in cm³/s is not interchangeable with g/s without further physical information. Higher-tier calculations may use amounts in moles: 0.0012 mol consumed in 40 s gives 0.000030 mol/s. That is a separate amount-based example, not a conversion from the gas volumes above. State the time unit consistently; dividing by minutes and labelling the result per second produces a factor-of-60 error.
Real readings have limited precision. A tangent drawn by eye, a gas-volume scale and the timing of observations can all affect an estimate. Repeat observations and compare curves over the same interval when judging whether a difference is meaningful. A lower final quantity is a different finding from a lower initial rate. Gas loss, evaporation, a changed limiting reactant or a different starting quantity can change a graph without the proposed cause being the only explanation. Measurement and controlled comparison belong together.
The invented rate graph is generated for teaching by V(t) = 60t/(t + 20) cm³ over 0 ≤ t ≤ 80 s. Learners do not need calculus to read the values, interval gradients or supplied tangent. The formula controls the example rather than claiming that every chemical reaction obeys this curve. At 80 s its volume is 48 cm³; the example does not assert exact completion or a perfectly horizontal graph there. Mean and tangent calculations answer different questions, and reading these worked examples does not establish independent practical or assessed competence.
Image: illustration, not a documentary photograph. This invented cumulative graph uses V(t) = 60t/(t + 20) cm³ over 0 ≤ t ≤ 80 s. The secants measure interval means; the tangent at 20 s has gradient 0.75 cm³/s and intercept 15 cm³. Its triangle vertices are points on the tangent, not measured curve readings. Numerical tangent calculation is Higher-tier content. Formula and stated coordinates control the example; the diagram is schematic, and a small preview supports recognition rather than reliable reading of coordinates or labels. No exact completion or experimental measurement is claimed.
Source and scope: Independent explanation, using version 1.2, 16 January 2026. Numerical tangent and mole-rate calculations are Higher-tier extensions; the curve is an invented teaching model. Independent assessment and full qualification coverage remain open.
Worked example: Use readings V(0)=0, V(20)=30 and V(40)=40 cm³. Calculate both interval mean rates and the mean over 0–40 s. Higher-tier extension: calculate the tangent gradient at 20 s from (10,22.5) and (30,37.5). Explain why dividing 37.5 by 30 is not that tangent rate.
For 0–20 s, subtract volumes: 30−0=30 cm³. Divide by 20−0=20 s to obtain 1.5 cm³/s.
For 20–40 s, use 40−30=10 cm³ over 20 s. The mean is 0.5 cm³/s, not 40/20.
Across 0–40 s the total increase is 40 cm³ over 40 s, so the mean is 1.0 cm³/s. Equal-duration interval means average to that value here.
Higher-tier extension: the tangent rise is 37.5−22.5=15 cm³ and its run is 30−10=20 s. Its gradient is 0.75 cm³/s.
37.5/30 describes a line from the origin to one tangent point. It ignores the tangent’s nonzero intercept and does not use two points on the same tangent to obtain its gradient.
Answer: The two interval means are 1.5 and 0.5 cm³/s, and the full 0–40 s mean is 1.0 cm³/s. Higher-tier tangent rate at 20 s is 0.75 cm³/s. It lies between the two interval means but is a local rate, not their average. Dividing 37.5 by 30 gives 1.25 cm³/s for the wrong line; the tangent does not pass through the origin.
Check your understanding: A different product graph rises from 12 to 36 cm³ between 15 and 45 s. Find its mean rate. Higher-tier extension: its tangent at a chosen time passes through (10,18) and (50,38); find that local rate. Separately, find the mean rates for 0.72 g lost in 90 s and 0.0012 mol consumed in 40 s.
Answer: The product increase is 36−12=24 cm³ over 45−15=30 s, giving 0.8 cm³/s. The Higher-tier tangent gradient is (38−18)/(50−10)=20/40=0.5 cm³/s. The mass-based mean is 0.72/90=0.008 g/s. The Higher-tier amount-based mean is 0.0012/40=0.000030 mol/s. These results measure different intervals or quantities and cannot be treated as conversions of one another.
Why: Subtract both cumulative quantities and times before dividing. A tangent triangle uses two points on the tangent, with its own rise and run. Preserve units and distinguish a local gradient from a mean over an interval; a graph intercept is not automatically a reaction reading.