Change the cause, keep the comparison fair
By UK GCSE Chemistry · independent study · myAudience
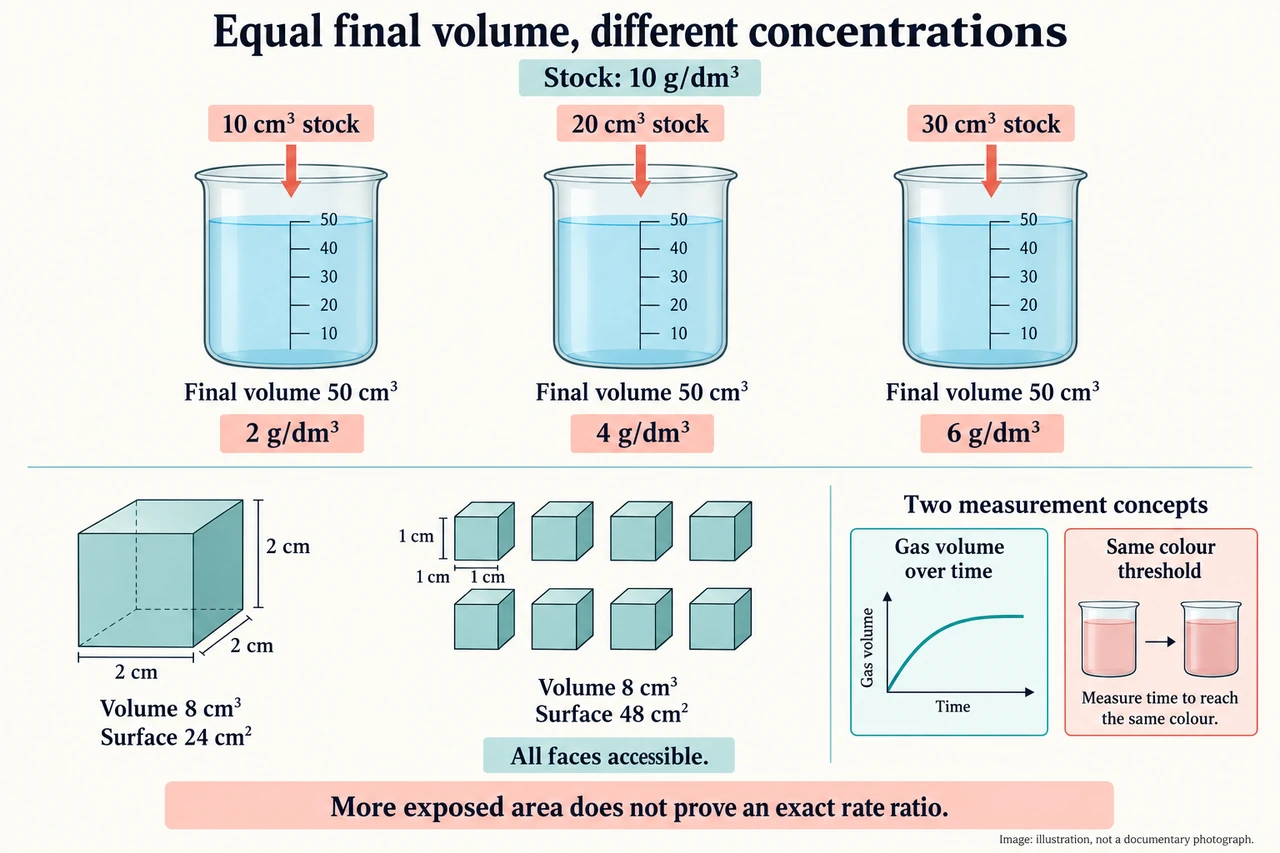
Image: illustration, not a documentary photograph. Three invented stock portions are diluted separately to the same final 50 cm³ volume, giving 2, 4 and 6 g/dm³. The ideal solid model compares one 2 cm cube with eight fully separated 1 cm cubes: conserved volume 8 cm³, exposed areas 24 and 48 cm² when all faces are accessible. This does not establish an exact rate ratio. Gas-volume and matched colour-threshold symbols distinguish measurement channels; no practical performance or chemical procedure is recorded. Small previews support recognition, not detailed label reading. · Original generated myAudience illustration; not a documentary photograph.
Change the cause, keep the comparison fair
A rate investigation asks whether changing one factor changes the speed of a reaction. That requires a comparison: deciding what to vary, what to measure and what to keep the same. Concentration, gas pressure, temperature, exposed solid surface and catalysts can affect reaction rate, but changing several together prevents us from assigning the difference to one of them. A hypothesis should predict a direction and give a reason, rather than promise a numerical rate ratio without a supporting model.
Collision theory connects the visible measurement with a particle-level explanation. Reacting particles must meet with enough energy for a successful reaction; merely having particles in the same container is insufficient. More particles per unit volume can make encounters more frequent. Increasing temperature also changes collision frequency and the fraction of encounters with sufficient energy. This explains a tendency, not a guarantee that every collision reacts or that doubling concentration doubles every reaction’s rate. Activation energy is the minimum energy that reacting particles must have for a successful reaction. Compressing a reacting gas at fixed temperature puts more particles into each unit volume, increasing collision frequency; it does not, by itself, raise the particles’ energy through a temperature change.
Prepare comparison solutions by keeping final volume fixed while changing the amount of dissolved reactant. An invented stock concentration of 10 g/dm³ supplies 0.10, 0.20 and 0.30 g in portions of 10, 20 and 30 cm³. Diluting each separate portion to 50 cm³ gives 2, 4 and 6 g/dm³. The final volume is 0.050 dm³, not 50 dm³. These solutions have equal volume but different solute amounts; describing them as containing the same mass would contradict the intended concentration change.
A gas-volume method follows product collected over time and supports a whole graph, not just a finishing time. Keep the solid reactant, apparatus, temperature, measuring interval and timing procedure consistent for a concentration comparison. In our hypothetical comparison the same fixed amount of solid is limiting and the dissolved reagent is declared to be in excess even in the lowest-concentration trial. Under the same gas temperature and pressure, complete reaction can then give the same final gas quantity with different rates. This shared endpoint depends on the stated limiting-reactant and collection assumptions; it does not follow from concentration alone.
A colour or turbidity method follows a different signal. One can compare the time taken to reach the same defined visible threshold under matched viewing conditions. The reciprocal 1/t is a useful comparative proxy when each trial reaches the same reaction extent. Times of 60, 30 and 20 s give reciprocal ratios 1:2:3. Those ratios are not automatically mol/s or g/s. Changing the threshold, light path, lighting or observer can change a time without reflecting the same amount of chemical change.
Exposed surface is different from the total amount of solid. In an ideal geometric model, a cube of side 2 cm has volume 8 cm³ and surface area 24 cm². Divide it into eight separated cubes of side 1 cm: their total volume is still 8 cm³ but their total area is 48 cm². More surface is available for encounters with another reactant. The model assumes all faces are accessible; touching pieces or clumps can conceal some of that area. Twice the calculated area does not, without further assumptions, establish exactly twice the observed reaction rate.
Good evidence includes repeated readings, control of temperature and an honest account of anomalies or uncertainty. A steep gas curve could arise from greater concentration, but a warmer solution or a different amount of solid could also contribute. A noisy colour endpoint needs a consistent criterion rather than selective timing. Decide how the data could distinguish the hypothesis from plausible alternatives. Separately introduced catalyst ideas are context here; they do not replace the dedicated catalyst topic or establish its full coverage.
This practical study includes both a gas-volume method and a colour-or-turbidity method for investigating concentration, together with a hypothesis and suitable control and evaluation. These written examples prepare the reasoning; they are not a completed practical, a record of measurements or instructions for an unsupervised chemical procedure. A supervised investigation needs the school’s chosen method, safety assessment, equipment skills and actual records. A useful conclusion states what the evidence supports and what remains uncertain, instead of treating a neat diagram or an invented number table as proof of performance.
Image: illustration, not a documentary photograph. Three invented stock portions are diluted separately to the same final 50 cm³ volume, giving 2, 4 and 6 g/dm³. The ideal solid model compares one 2 cm cube with eight fully separated 1 cm cubes: conserved volume 8 cm³, exposed areas 24 and 48 cm² when all faces are accessible. This does not establish an exact rate ratio. Gas-volume and matched colour-threshold symbols distinguish measurement channels; no practical performance or chemical procedure is recorded. Small previews support recognition, not detailed label reading.
Source and scope: Independent explanation, using version 1.2, 16 January 2026. Written practical study preparation covers gas-volume and matched colour/turbidity reasoning, not performed practical competence. Activation energy and fixed-temperature gas compression are explicit collision-theory context. Independent assessment and full qualification coverage remain open.
Worked example: A 10 g/dm³ stock is used to make three separate 50 cm³ comparison solutions from 10, 20 and 30 cm³ portions. Find each solute mass and final concentration. Fixed-threshold colour times are 60, 30 and 20 s. Compare the reciprocal-time ratios and explain the conditions required for a fair inference.
Convert stock portions to 0.010,0.020 and 0.030 dm³. Multiply each by 10 g/dm³ to obtain 0.10,0.20 and 0.30 g.
Each final 50 cm³ is 0.050 dm³. Divide solute masses by this common final volume: 2, 4 and 6 g/dm³.
The reciprocal times are 1/60,1/30 and 1/20 s⁻¹. Relative to 1/60, their ratios are 1:2:3.
Equal final volumes do not mean equal solute amounts. For the timing comparison, require the same visible threshold and matched viewing conditions, temperature and other reaction conditions.
The reciprocal-time values are comparative proxies, not independently measured mass- or mole-based rates. The numbers do not establish a general rate law or completed required-practical performance.
Answer: The portions contain 0.10,0.20 and 0.30 g and make concentrations 2, 4 and 6 g/dm³ in 0.050 dm³ each. Fixed-threshold reciprocal times compare as 1:2:3. This is meaningful only when the same reaction extent and viewing criterion are used with the other variables controlled. Equal final volume retains different solute masses. No mol/s rate, general concentration law or performed practical is established.
Check your understanding: An ideal 2 cm cube is split into eight separate 1 cm cubes. Compare total volume and exposed area. In a separate colour investigation, a trial takes 30 s to reach one threshold and another takes 15 s to reach a different threshold. May we conclude that the second reaction is twice as fast?
Answer: The original volume is 2³=8 cm³ and area 6×2²=24 cm². Eight 1 cm cubes have total volume 8×1³=8 cm³ and total area 8×6×1²=48 cm², assuming every face is accessible. The geometric area doubles; exact rate doubling does not follow automatically. The colour inference is invalid because the thresholds differ, so the trials may represent different extents of reaction. Match the endpoint and control viewing conditions before comparing 1/t as a proxy.
Why: Keep amount, concentration, exposed area and measurement criterion distinct. A calculation can verify dilution or geometry while leaving the kinetic relationship unresolved. Comparable times require comparable endpoints; unequal conditions prevent an isolated causal conclusion.