Comparing biomass across feeding positions
By UK GCSE Biology · independent study · myAudience
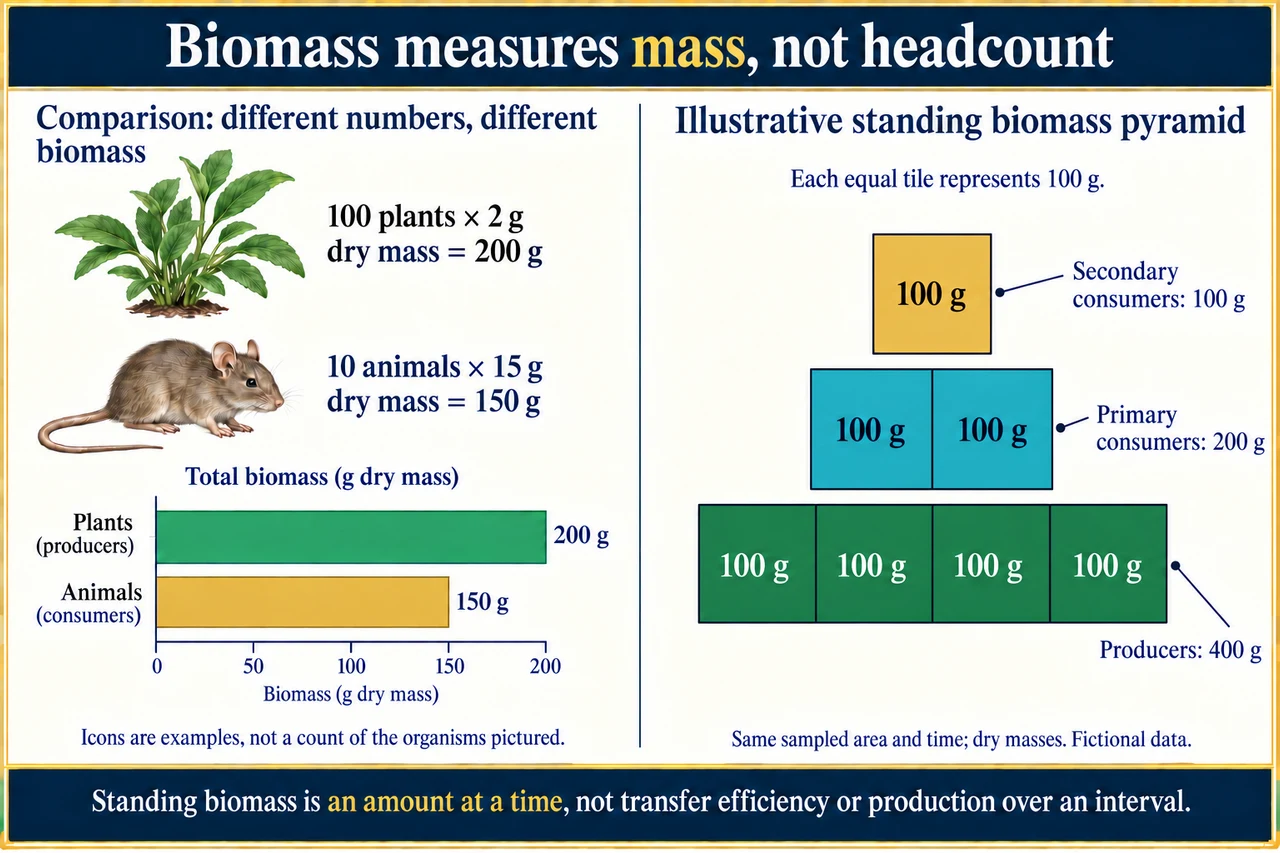
Original myAudience scientific illustration; not a documentary photograph or measured specimen. · Original generated project artwork; source concepts reviewed, no textbook figures copied.
Comparing biomass across feeding positions
Biomass measures biological material, commonly compared using dry mass to reduce effects of variable water content. A biomass pyramid represents the amount at different feeding levels in a specified system. It is not simply a count of individuals.
A biomass diagram represents an amount under stated conditions, not every detail of productivity or transfer over time. Explain whether the data concern one area and moment or another measure. Bars must start from an appropriate scale and correspond to the stated dry masses; decorative shapes or relative organism size in artwork are not measurements.
Dry mass reduces variation caused by different water content and provides a defined biomass measure. A pyramid should use a shared scale so each width represents its stated mass. Ten organisms are not necessarily more biomass than one much larger organism. State whether the values represent a standing amount at one time or biomass produced over an interval; comparing those different measures as though they were identical can produce a misleading conclusion.
Worked example: Which has more dry biomass: 100 plants of 2 g each or 10 animals of 15 g each?
Plants total 100×2=200 g
Animals total 10×15=150 g
Answer: The plants have the greater dry biomass in this comparison.
Check your understanding: Is biomass the same as number of organisms?
Answer: No.
Why: Biomass accounts for their mass, not merely how many individuals there are.