Analysing tissue mass changes by osmosis
By UK GCSE Biology · independent study · myAudience
Original myAudience scientific illustration; not a documentary photograph or measured specimen. · Original generated project artwork; no textbook figure copied.
Analysing tissue mass changes by osmosis
Plant tissue can gain or lose water when placed in solutions of different solute concentrations. This practical study studies mass changes, using osmosis as the explanation for net water movement across selectively permeable cell membranes. Comparable tissue dimensions, exposure time, temperature and source help make concentration comparisons meaningful. This is preparation and analysis, not a record that a practical has been completed.
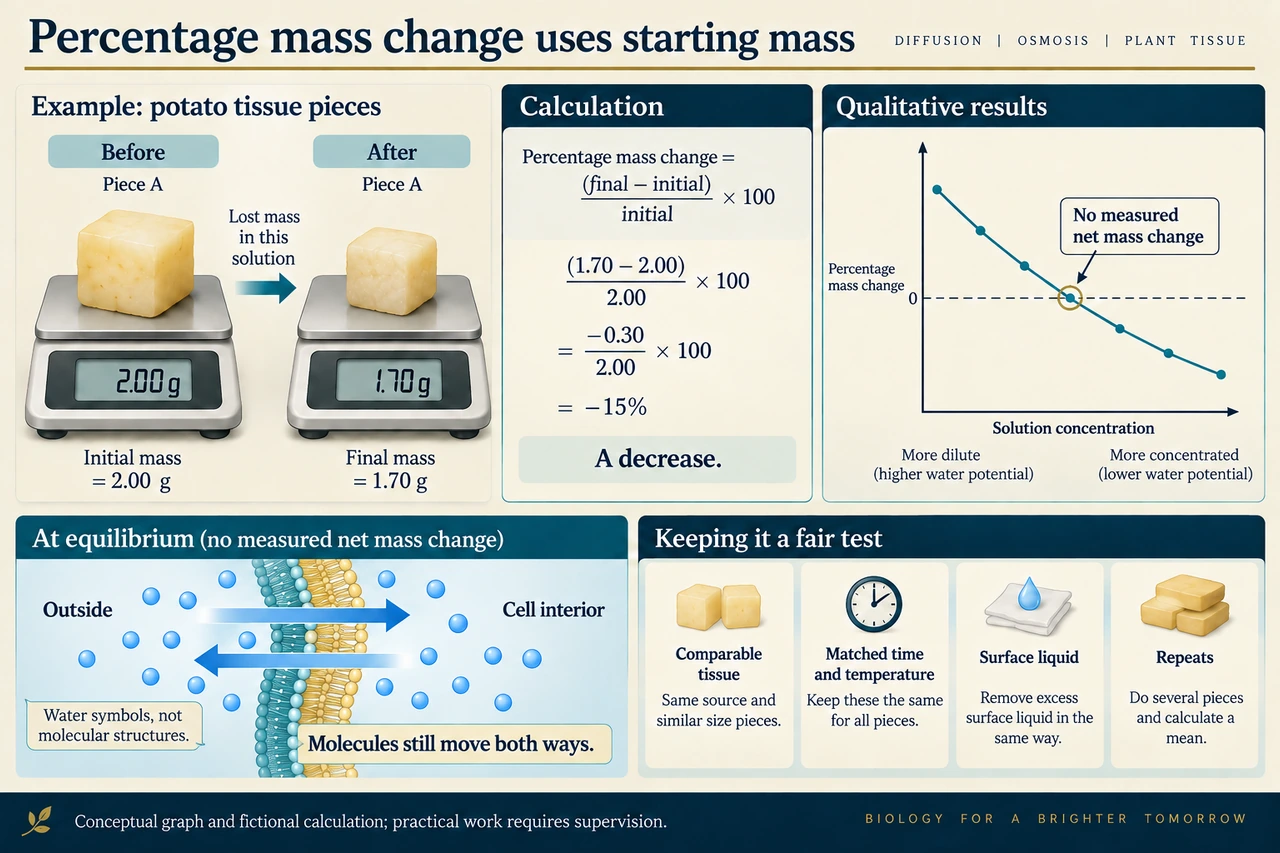
Percentage change uses the starting mass as its denominator: (final − initial) / initial × 100. This allows comparison between pieces that do not have identical initial masses. Standardised removal of surface liquid before weighing matters, because retained solution can change the measured mass without having entered cells. Repeats show variability, and anomalous observations need investigation rather than automatic deletion.
Plot solution concentration on the horizontal axis and percentage mass change on the vertical axis. A crossing near zero can estimate the concentration where there is no measured net mass change under the conditions used. Cells still exchange water molecules in both directions; zero net change does not mean molecular movement stopped. Damaged tissue or uncontrolled conditions can limit that estimate.
Worked example: A piece changes from 2.00 g to 1.70 g. Calculate its percentage mass change.
Mass change is 1.70 − 2.00 = −0.30 g.
Divide by 2.00 g and multiply by 100.
Answer: The mass change is −15%, a decrease.
Check your understanding: Why divide by initial mass rather than final mass?
Answer: Initial mass is the reference for the change.
Why: Using a different denominator defines a different percentage and prevents a fair comparison.