Estimating abundance and testing a habitat gradient
By UK GCSE Biology · independent study · myAudience
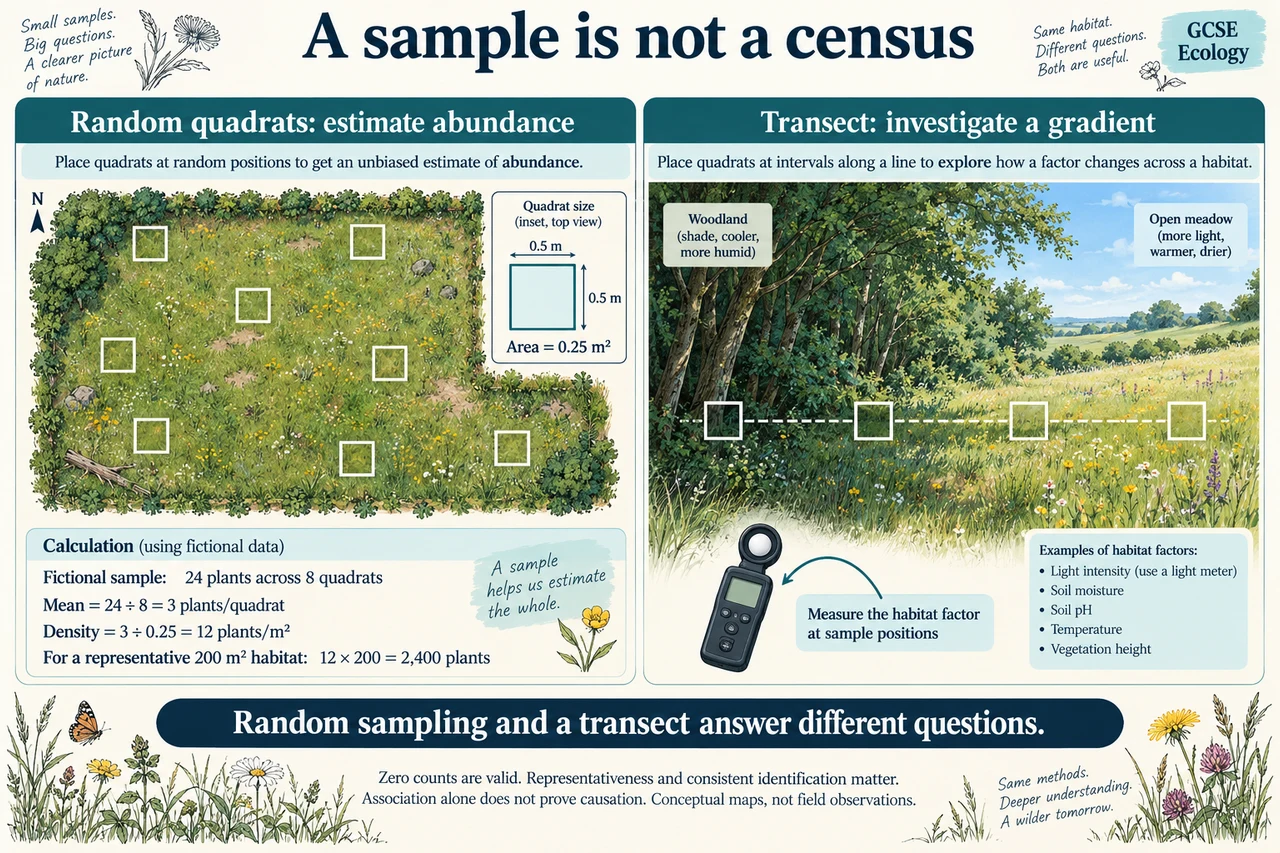
Original myAudience scientific illustration; not a documentary photograph or measured specimen. · Original generated project artwork; source concepts checked, no textbook figures copied.
Estimating abundance and testing a habitat gradient
This practical study links population estimates with distribution along a habitat factor. Random quadrats help estimate abundance without choosing attractive patches; a transect samples a defined gradient. These answer different questions. Identify the species consistently and specify whether the recorded outcome is count, cover or presence, because those values cannot be interchanged as though they were identical measurements.
For equal quadrats, calculate mean count and divide by quadrat area to obtain estimated density. Multiply density by habitat area only if the sample represents that habitat. A transect can compare abundance with measured light, moisture or another factor, but associated changes in grazing or soil can complicate causation. More appropriately located samples reduce sampling uncertainty; a large number of biased samples can still give a poor estimate.
State boundaries, units and sampling effort so another observer can understand the estimate. A zero count in one quadrat is valid data, not automatically a failed sample. Avoid trampling protected habitats or disturbing organisms, follow permissions and site risk assessment, and report estimates with their assumptions. The arithmetic does not turn a sample into a complete census.
Worked example: Eight 0.25 m² quadrats contain 24 plants altogether. Estimate a representative 200 m² habitat.
Mean count is 24 / 8 = 3 per quadrat.
Density is 3 / 0.25 = 12 plants/m².
Estimated total is 12 × 200.
Answer: The estimate is 2,400 plants, subject to representative-sampling assumptions.
Check your understanding: Why is a deliberately chosen densest patch a poor abundance sample?
Answer: It systematically overrepresents high density.
Why: Repeating a biased selection method does not make the sample representative.