Enzymes change reaction rates
By UK A Level Biology · independent study · myAudience
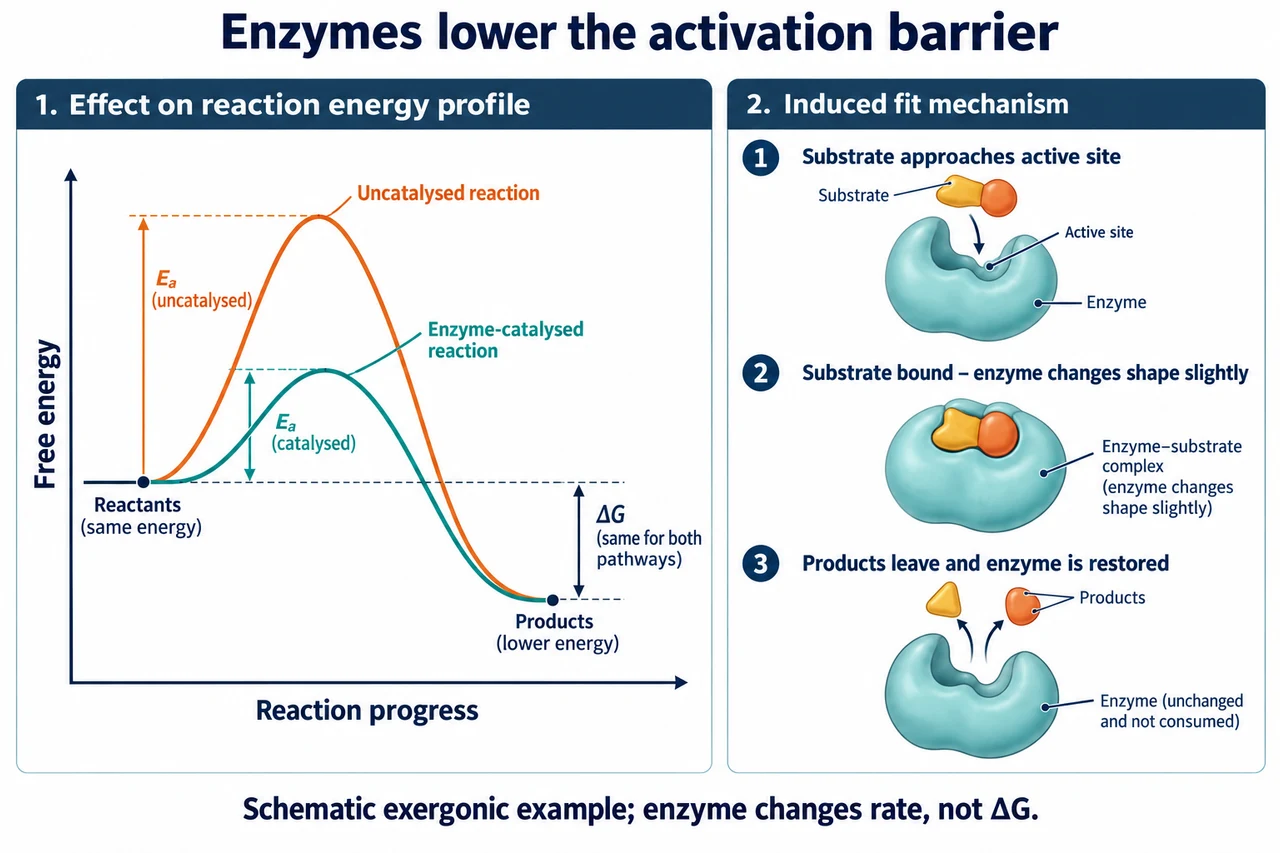
Original myAudience scientific illustration; not a documentary photograph or measured specimen. · Original generated project artwork; no source textbook figures reused. Sources support scientific review, not copied-art licensing.
Enzymes change reaction rates
An enzyme offers a reaction pathway with a lower activation-energy barrier. Substrate binding involves a shaped active site that can adjust during binding. The enzyme is not used up by a single catalytic event, although its structure can be damaged.
Increasing substrate concentration eventually stops raising the rate when available active sites are occupied. Temperature and pH affect activity and shape. A competitive inhibitor competes for the active site; a noncompetitive model describes inhibition through another binding site.
An initial-rate comparison is most useful before substantial substrate depletion or product accumulation changes conditions. To isolate an effect, vary one factor and control others, including enzyme amount and timing. Replicates reveal variation; an apparently exact single reading does not establish the reliability of a rate estimate.
In the simple competitive model, extra substrate can reduce an inhibitor’s effect because both compete for active sites. In a simple noncompetitive model, raising substrate does not restore the same maximum rate. Real mechanisms can be more complex, so match a prediction to the stated model rather than use inhibitor as one universal explanation.
Induced fit describes adjustment during substrate binding, rather than an entirely rigid lock. More enzyme can increase available active sites when substrate is adequate, while more substrate eventually reaches a limit set by the available enzyme. A tangent at the beginning of a product–time graph estimates instantaneous initial rate; a chord over six seconds gives an average over that interval. These are different measurements, even when their numerical values happen to be close.
Worked example: Product concentration rises from 0 to 18 units in the first 6 seconds. Estimate the mean initial interval rate.
Divide the concentration change by elapsed time.
18 / 6 = 3.
Answer: 3 units per second over that interval, not necessarily the instantaneous rate at time zero.
Check your understanding: Why does adding more substrate sometimes fail to increase rate?
Answer: The available enzymes are saturated.
Why: The number of active sites limits simultaneous catalytic events.