Allele frequencies describe populations
By UK A Level Biology · independent study · myAudience
Original myAudience scientific illustration; not a documentary photograph or measured specimen. · Original generated project artwork; no source textbook figures or paragraphs reused. Sources support concept review, not copied-art licensing.
Allele frequencies describe populations
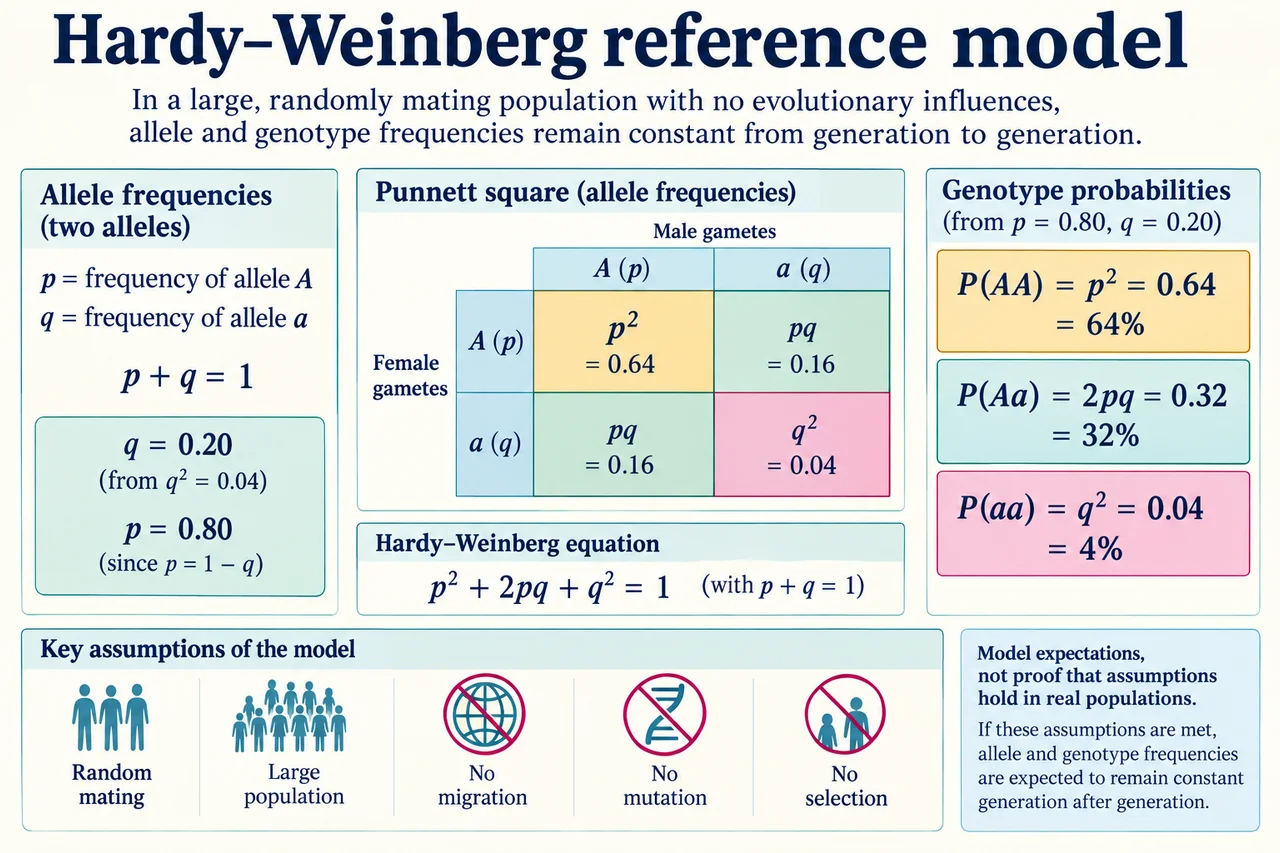
A population’s gene pool includes its alleles. Allele frequencies can change through selection, drift, migration and mutation. The Hardy–Weinberg model provides a reference under specified assumptions, including random mating and no relevant evolutionary changes.
For a two-allele model, p+q=1 and expected genotype frequencies are p², 2pq and q². Applying the equations requires suitable assumptions; agreement with a prediction does not prove that every assumption holds. Rare recessive alleles can remain in heterozygotes without producing the recessive phenotype.
With a recessive genotype frequency q² = 0.04, q is 0.2, p is 0.8 and the expected heterozygote frequency 2pq is 0.32. These are frequencies, not interchangeable individual counts. In a finite population, random reproductive sampling can shift allele frequencies without a selective advantage; that effect is especially important in small populations.
Worked example: Assuming Hardy–Weinberg conditions and complete recessiveness, the recessive phenotype frequency is 0.04. Estimate heterozygote frequency.
q² = 0.04, so q = 0.2.
p = 0.8.
2pq = 2×0.8×0.2 = 0.32.
Answer: 0.32, or 32%.
Check your understanding: Can a small population change allele frequencies through chance alone?
Answer: Yes, through genetic drift.
Why: Random sampling of alleles between generations can alter frequencies without an advantage.