Insulation: follow every path heat can take
By How things work · myAudience
myAudience original rendered teaching illustration. Image: illustration, not a documentary photograph. · Operator-authored generated illustration; scientific model reviewed separately.
Insulation: follow every path heat can take
Insulation reduces thermal energy transfer between places at different temperatures. Building heat moves through walls and windows, through air leakage and through intentional ventilation; sunlight and internal activities also affect the balance. Insulating a wall does not remove every other route. A comfortable, healthy building requires moisture and air-quality reasoning alongside lower heating or cooling demand.
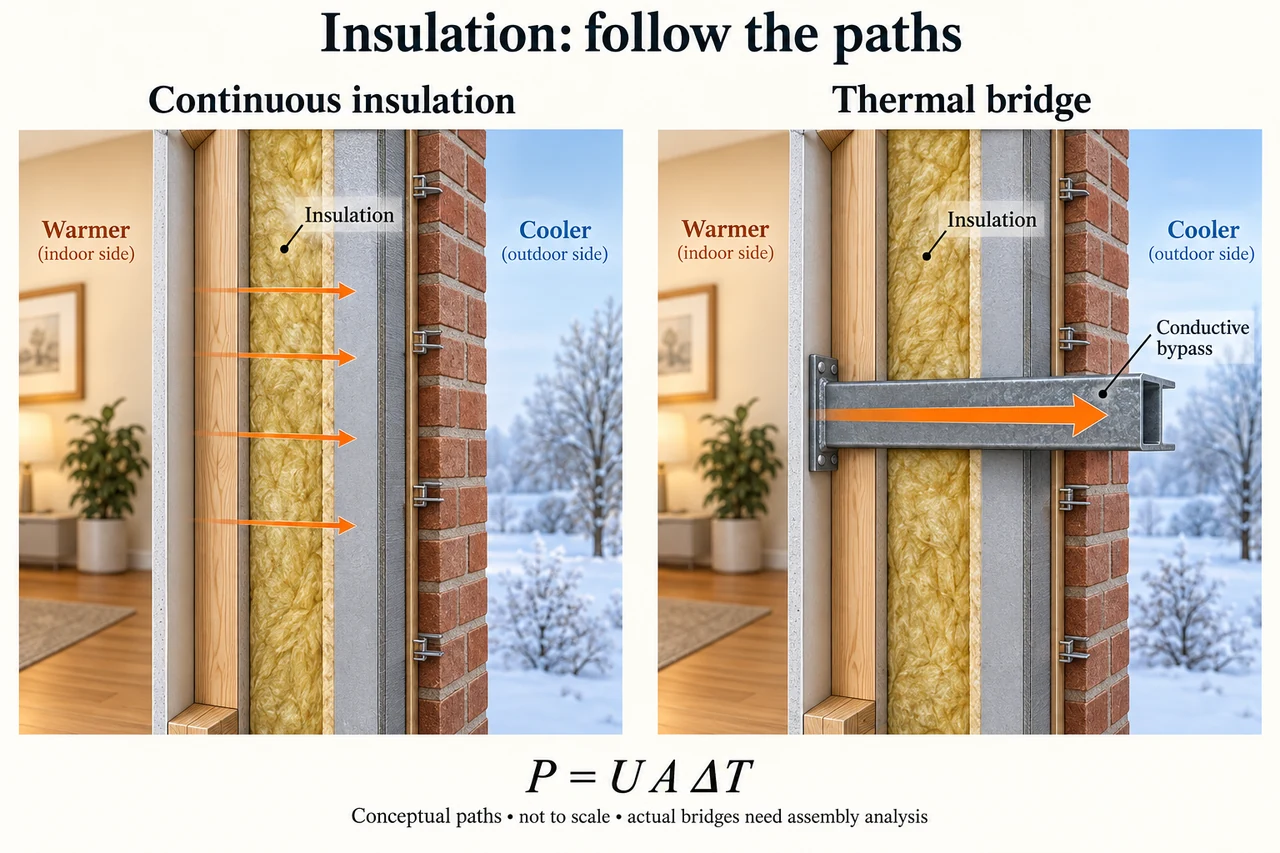
The plate contrasts a continuous insulated wall with a simplified thermal bridge: a conductive member bypasses part of the insulation. Arrows indicate heat flow from the warmer side to the cooler side, not cold material flowing inward. The cavity insulation is part of an assembly with surfaces, structure and finishes. This visual is a model of competing paths, not a specification for a particular wall, climate or fire-resistant system.
For a simple steady wall, heat-transfer rate can be estimated as P = U A ΔT, with U the assembly transmittance in W/(m² K), A its area, and ΔT the temperature difference. Doubling area doubles that term; halving U halves it. Thermal resistance values cannot be added without checking the units and area convention. For layers of one-dimensional conduction over the same area, resistances add in series; an additional conductive path is parallel and adds heat flow rather than adding protection.
Use a deliberately simplified two-path model: 18 m² of wall has U = 0.30 W/(m² K), while 2 m² of bridging area has U = 2.0. At a 20 K difference, their heat rates are 108 W and 80 W, totalling 188 W. Although the bridge occupies only 10% of the area, it contributes about 43% of this modelled transfer. Multiplying all 20 m² by the better U would predict 120 W and miss 68 W. Actual thermal bridges often require two-dimensional analysis, so these are explanatory areas, not approved design coefficients.
Lower heat loss cannot justify sealing a building without adequate ventilation. Construction choices must also consider damp, condensation, material durability, fire performance, installation quality and maintenance. Discuss a retrofit offered to tenants: who receives lower bills, who pays, and what evidence protects indoor air quality and those unable to report problems? Compare lifecycle material impacts with operational energy under a declared climate and service-life assumption, rather than declaring one material universally green.
Transfer the model to a milder day: if ΔT halves with all coefficients fixed, the steady conduction contribution halves; the whole building electricity bill need not. Fans, hot water, appliances, solar gains and heating efficiency are outside this narrow boundary. An invented quoted percentage reduction in wall conduction must not be sold as the same percentage reduction in total energy spending. Existing insulation is established technology; a claim about a new material needs independently tested assembly performance, not merely an attractive microscopic image.
Image: illustration, not a documentary photograph.
Worked example: An invented 12 m² wall has U = 0.40 W/(m² K) and ΔT = 25 K. A retrofit reduces U to 0.25. Compare steady conduction rates and the percentage reduction.
Before: 0.40 × 12 × 25 = 120 W.
After: 0.25 × 12 × 25 = 75 W.
Reduction = 45/120 = 0.375 = 37.5%.
Answer: 120 W before,75 W after; 37.5% reduction in this wall conduction term only.
Check your understanding: A wall contribution falls from 200 W to 100 W, but unchanged other modelled losses total 300 W. Does total heat loss halve?
Answer: No. Total falls from 500 W to 400 W, a 20% reduction. A 50% wall reduction is not a 50% whole-building reduction.
Why: Declare the system boundary and assumptions before applying conservation. Invented values test reasoning, not a real installation.