Why moving air can turn a generator
By How things work · myAudience
myAudience original rendered teaching illustration. Image: illustration, not a documentary photograph. · Operator-authored generated illustration; scientific concept model reviewed separately.
Why moving air can turn a generator
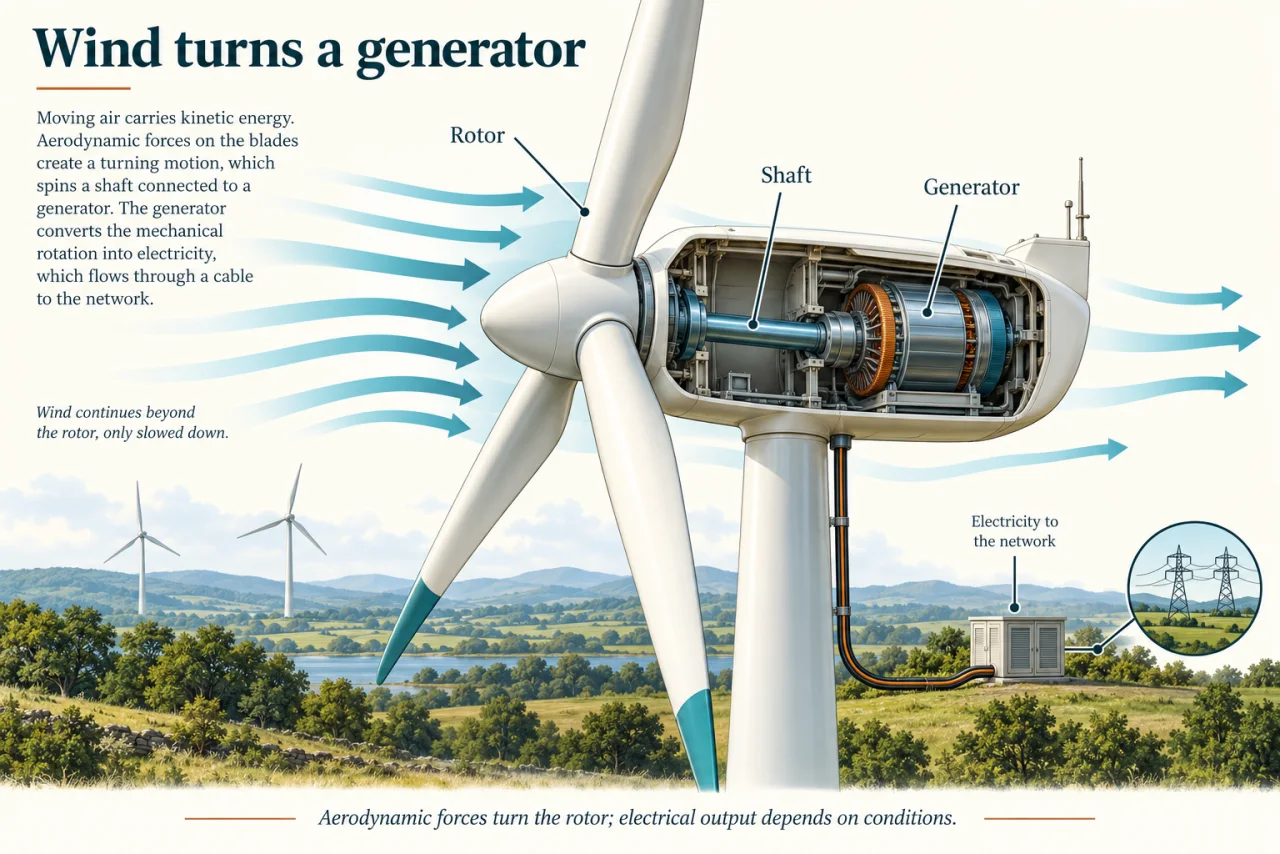
A wind turbine intercepts some of the kinetic energy carried by moving air. Aerodynamic forces on its blades produce a turning effect, or torque, on the rotor. The shaft carries mechanical power to a generator. This differs from a motor, which uses electrical input to produce mechanical output. The air is not consumed like a fuel: it continues downstream, generally with less kinetic energy after transferring some to the turbine.
The cutaway depicts a direct-drive arrangement. Follow the shaft from the blade hub to the generator inside the nacelle, then follow the electrical cable down the tower toward the network. The blue arrows continue beyond the rotor because stopping all the air would also prevent a continuing flow through the machine. Other established designs put a gearbox between rotor and generator. The plate is a mechanism model, not a universal inventory of every turbine component.
Available wind power can be derived from two simpler relations. A mass m moving at speed v has kinetic energy ½mv². In a steady ideal stream, the mass passing a swept area A each second is approximately ρAv, where ρ is air density. Multiplying energy per kilogram by kilograms per second gives available kinetic power ½ρAv³. The units become kilograms × metres² per second³, equivalent to watts. This is incoming-flow power, not a turbine’s electrical rating.
The cubic dependence means that doubling wind speed multiplies available kinetic power by eight when density and area are held fixed. It does not mean electrical output always increases eightfold: real turbines have aerodynamic limits, losses and control systems, and can restrict output or stop in unsuitable conditions. Likewise, the expression cannot be used with a gust measured at an unrelated height as if it described the entire rotor. The model is useful because its assumptions are visible. The capture fraction also has a physical boundary. The conventional ideal rotor-flow model gives a maximum near 0.59, below one: extracting energy slows the air, while continuing flow is necessary to bring more energy through the rotor. This is a limit for that model, not a measured efficiency of every turbine. A proposed 65% capture fraction requires scrutiny of the model and measurement boundary, even before generator losses.
A useful energy chain separates incoming wind power, mechanical shaft power and electrical output. Multiply by a justified capture fraction and then a generator efficiency to model those boundaries. Neither fraction is greater than one. A larger rotor changes swept area; a longer blade is not merely decorative. Weather variability means instantaneous power and energy accumulated over a day are separate questions. Grid integration must deal with variation rather than assuming wind is constant. For variable wind, calculate output for each interval, applying capture, conversion and a stated controller limit before summing energy. Because speed is cubed, cubing an average speed is not the same as averaging cubed speeds. A rating cap adds another nonlinear step. Neither a site’s mean speed nor one exciting gust is enough to determine daily energy.
Wind generation is established, while particular rotor materials, floating platforms and control ideas have different deployment histories. This lesson explains the conversion chain rather than certifying any design. A good site assessment considers wind measurements, maintenance access, wildlife, noise, transmission and effects on nearby people. Technical success is more than turning a shaft once, and a favourable resource estimate does not make every location appropriate.
Discuss: a proposed wind project benefits a wider electricity network but affects a small local community. Compare compensation, meaningful consultation, wildlife evidence and alternatives. Which safeguards would make a decision fairer even if residents disagree about the final outcome?
Image: illustration, not a documentary photograph.
Worked example: Use air density 1.2 kg/m³, rotor area 10 m², capture fraction 0.40 and generator efficiency 0.90. Wind is 5 m/s for one hour and 10 m/s for one hour. The simplified controller caps electrical output at 500 W. Calculate energy and compare it with using the mean speed 7.5 m/s for two hours.
At 5 m/s: incoming power = 0.5 × 1.2 × 10 × 5³ = 750 W. Shaft power = 300 W; electrical output = 270 W.
At 10 m/s: incoming power = 6,000 W. Potential electrical output = 6,000 × 0.40 × 0.90 = 2,160 W, but the cap gives 500 W.
Two-interval energy = 270 × 1 + 500 × 1 = 770 Wh = 0.770 kWh.
At mean speed 7.5 m/s: incoming power = 2,531.25 W and potential electrical output = 911.25 W; the cap gives 500 W for two hours = 1,000 Wh.
The average-speed method overestimates this capped example by 230 Wh. Without the cap, its error would differ; model each physical stage before summing.
Answer: 0.770 kWh from the time series, compared with an invalid mean-speed estimate of 1.000 kWh.
Check your understanding: A rotor claims 65% extraction of the kinetic power calculated by ½ρAv³ and a generator efficiency of 90%, under the conventional ideal rotor-flow assumptions. Is multiplying to obtain 58.5% sufficient to validate the claim?
Answer: No. The capture factor itself exceeds the approximately 59% limit of the stated model. A downstream efficiency multiplier cannot repair an upstream physical inconsistency.
Why: Validate each boundary independently. If the reported denominator or flow arrangement differs, redefine and justify the model before comparing percentages.