Four piston strokes make one engine cycle
By How things work · myAudience
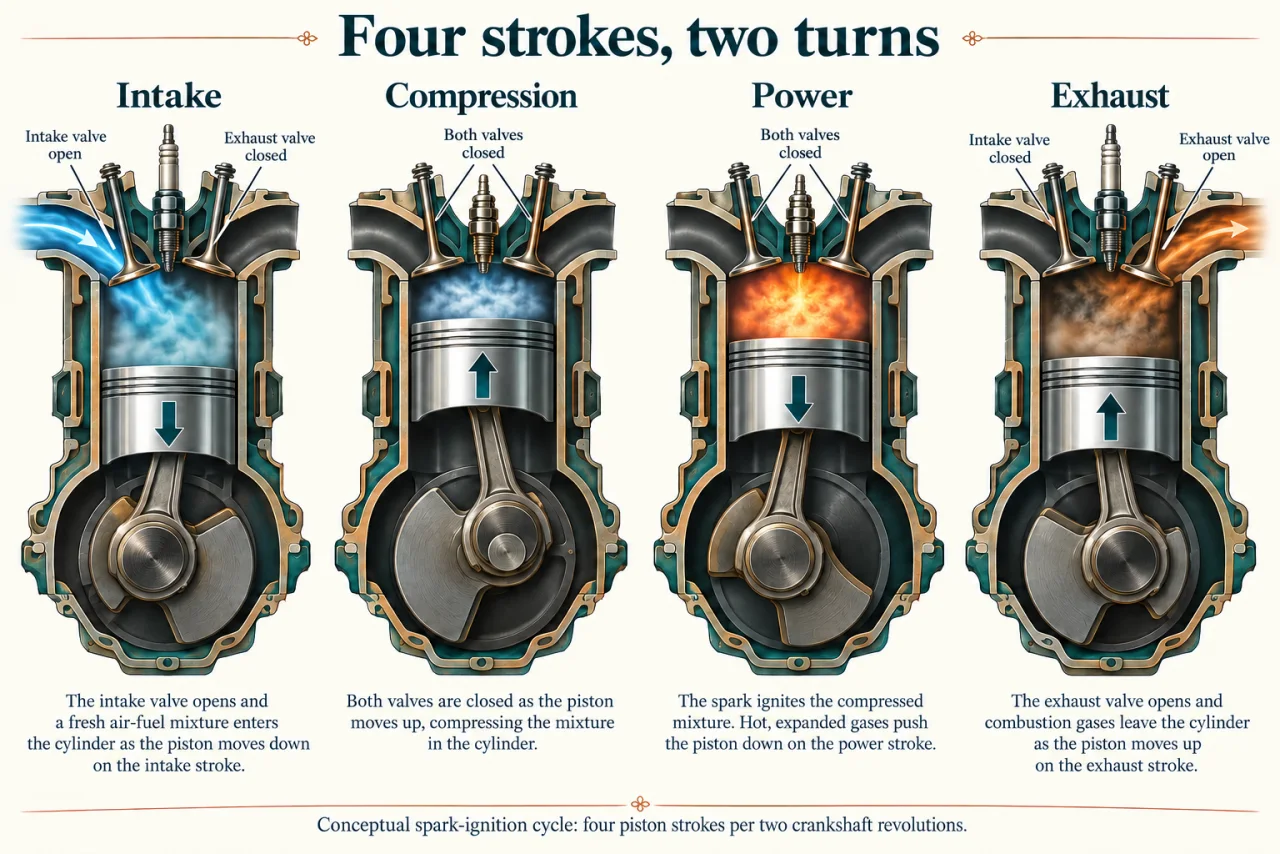
myAudience original rendered teaching illustration. Image: illustration, not a documentary photograph. · Operator-authored generated illustration; scientific concept model reviewed separately.
Four piston strokes make one engine cycle
A spark-ignition engine converts some fuel chemical energy into useful shaft work. Combustion creates hot gas whose pressure acts on a piston; a connecting rod and crankshaft relate the piston’s back-and-forth movement to rotation. A four-stroke cycle describes four successive piston movements, not four revolutions of the crankshaft. An individual cylinder completes those four strokes during two crankshaft revolutions.
Read the image’s four panels in order. During intake the piston moves down and the intake valve is open. During compression it moves up with the valves closed. In the power panel, ignition has occurred and expanding hot gas pushes the piston down. During exhaust it moves up while the exhaust valve is open. The straight arrows show piston motion; panel spacing is not a measured time scale. The coloured gases and visible flame are explanatory representations, not a diagnostic photograph.
Compression requires work on the gas before the power stroke can return work from it. Momentum in rotating components and, in multi-cylinder engines, other cylinders helps carry the machine through its non-power strokes. It is therefore misleading to label every downward movement a power-producing event: intake is also downward but serves a different purpose. The intake, compression, power and exhaust sequence is what determines the role of each movement. Net gas work over a complete cycle must subtract work done on the gas from work returned by it, with pumping effects included in the declared boundary. Pressure acting through a piston displacement transfers work; an ideal pressure-volume cycle represents net work as an enclosed area. The four-panel image explains valve and stroke order but contains no measured pressure-volume plot, so it cannot supply work per cycle from appearance alone.
The diagram is a simplified spark-ignition model with a premixed intake charge. Actual fuel injection, valve timing and ignition control differ by design, and valves can overlap near transitions. Combustion takes a finite time; real engines also exchange heat with their surroundings. An ideal thermodynamic cycle can clarify relationships, but its assumptions must not be treated as exact descriptions of every instant in a real engine.
For one four-stroke cylinder, ideal cycle frequency is half the crankshaft revolution frequency. If the shaft turns at n rpm, cycles per second are n ÷ 120. A multi-cylinder count can add event frequencies, but that alone does not determine net power: work per cycle, losses and timing also matter. More firing events are not automatically a higher efficiency, and an rpm figure is not an energy consumption measurement. Keep three outputs separate: net work transferred by the cylinder gas, indicated power from that work and cycle frequency, and brake power available at the shaft after mechanical losses. Fuel input rate is a fourth boundary. Shaft efficiency compares brake output with fuel chemical input; it is not the same as the fraction remaining after mechanical friction alone.
Spark-ignition engines are established; new fuels and combustion strategies need separate emissions, durability and supply evidence. Useful shaft output is only part of the energy balance: exhaust, cooling and mechanical losses matter too. The NASA sources use a historical Wright engine and ideal analysis to teach fundamentals. This lesson adopts the stroke sequence while excluding the old engine’s particular ignition hardware and claims that real strokes have exactly zero heat transfer.
Discuss: reliable engines can support livelihoods where alternative infrastructure is limited, yet fuel use and exhaust affect other people. Compare access, local air quality, climate effects, maintenance and the realistic alternatives available. How could a transition protect people who depend on existing machines?
Image: illustration, not a documentary photograph.
Worked example: A hypothetical single-cylinder four-stroke engine runs at 3,000 rpm. In each complete cycle the gas delivers 120 J during expansion and consumes a combined 70 J for compression and pumping. Mechanical loss is 300 W; fuel chemical input is 5,000 W. Find indicated power, shaft power and shaft efficiency. Compare with 6,000 rpm if net cycle work falls to 30 J and mechanical loss rises to 500 W.
At 3,000 rpm, frequency = 3,000/120 = 25 complete cycles per second.
Net cycle work = 120 − 70 = 50 J. Indicated power = 50 × 25 = 1,250 W.
Shaft power = 1,250 − 300 = 950 W. Shaft efficiency = 950/5,000 = 0.19, or 19%.
The supplied balance leaves 5,000 − 950 = 4,050 W in other outputs. Identifying individual heat and exhaust contributions needs further measurements.
At 6,000 rpm, frequency = 50 cycles/s. With 30 J per cycle, indicated power = 1,500 W; shaft power = 1,500 − 500 = 1,000 W.
Doubling rpm raises this modeled shaft output only from 950 to 1,000 W. Efficiency at the second point cannot be calculated without its fuel input.
Answer: 1,250 W indicated, 950 W shaft and 19% shaft efficiency initially; 1,000 W shaft at the second point, whose fuel efficiency remains unknown.
Check your understanding: A claim estimates shaft power by multiplying only 120 J expansion work by 25 cycles/s, then subtracting 300 W mechanical loss. Explain which boundary it omitted and calculate the error.
Answer: It omits 70 J per cycle required for compression and pumping: 70 × 25 = 1,750 W. It predicts 2,700 W instead of the stated-model 950 W.
Why: Gross expansion work is not net work over a closed cycle. The engine must perform non-power processes too, even though the image’s power panel is the most visually dramatic.