Water purification: barriers remove different things
By How things work · myAudience
myAudience original imagegen teaching illustration; illustration, not a documentary photograph. · Original generated illustration; scientific and publication acceptance pending independent review.
Water purification: barriers remove different things
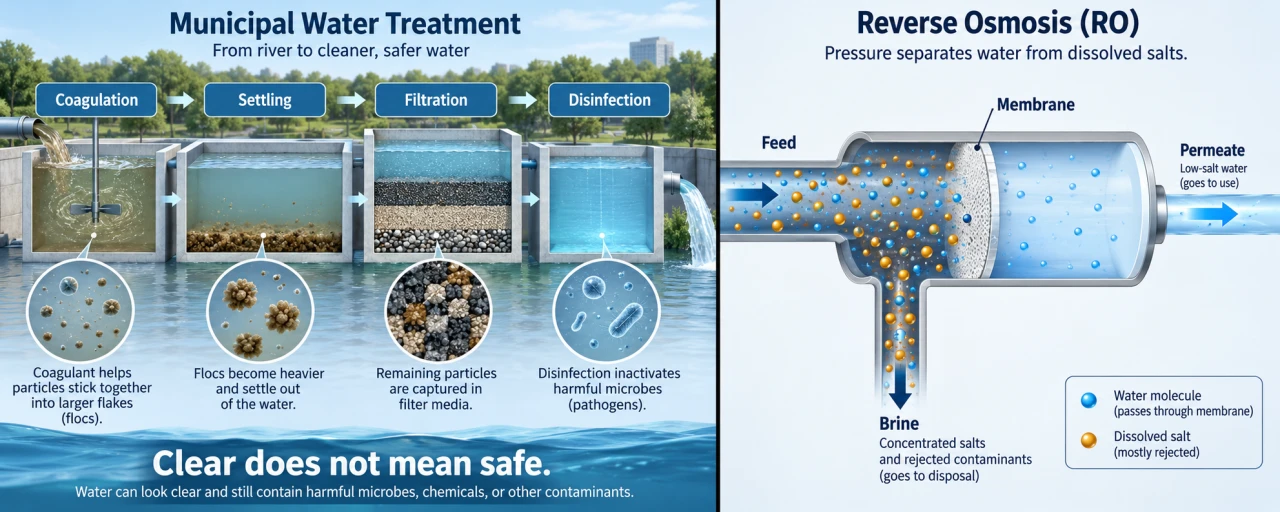
A treatment train works because different stages address different contaminants. Coagulation destabilizes suspended particles so they can form flocs; settling removes separable flocs, filtration retains further particles, and disinfection inactivates susceptible organisms. The drawing gives one conceptual surface-water sequence, not a universal recipe.
Particle capture is not the same as removal of dissolved ions, and inactivation is not the same as physical removal. Activated carbon can adsorb certain dissolved organic substances, while ion exchange and membranes address other cases. Selecting a process requires evidence about the source water and the contaminant, rather than a single claim that water looks clean.
For an explicitly idealized count model, each independent barrier passes a surviving fraction s. Two barriers give Nout = Nin s1 s2, so 90% followed by 99% removal means 0.10 × 0.01 = 0.001 surviving, not 189% removal. Log reductions add because −log10(s1s2) = −log10(s1) − log10(s2).
That multiplication assumes each quoted reduction actually holds for the incoming water and target organism. A common upstream failure can degrade several downstream barriers at once; repeated nominal ratings are not evidence of independent protection. Monitoring breakthrough, filter condition and treatment performance matters more than color alone. The count calculation below is not a safe-drinking-water threshold.
Use the left treatment-train panel: captions distinguish formation of flocs, settling, particle capture and organism inactivation. Tank-to-tank arrows show process order, not detailed hydraulic routing through filter media. The right RO panel concerns selective permeation and a concentrated remainder; that is not a promise that the left particle barriers remove dissolved salts.
For discussion, water-treatment decisions affect people unable to buy household filters. What public monitoring, maintenance funding and transparent failure reporting would be needed before claiming reliable access? A target-particle log reduction is not a substitute for contaminant-specific evidence or accountability.
Image: illustration, not a documentary photograph.
Worked example: A fictional particle counter measures 2,000,000 target particles/L. Stage A passes 10%, stage B passes 1%. Flow is constant; target reductions are independent and stable. Find residual count and combined log reduction.
After A: 2,000,000 × 0.10 = 200,000/L. After B: 200,000 × 0.01 = 2000/L.
Survival fraction = 0.001; removal = 99.9%; −log10(0.001) = 3 log reduction.
Particle number concentration is a count/L, not mass concentration or a guarantee of pathogen inactivation.
Answer: 2000 target particles/L and 3-log reduction for this target and invented model.
Check your understanding: 1: Stage B degrades to 90% removal; find output. 2: Why can a 3-log result for particles not establish dissolved-salt removal or potable safety?
Answer: Survival becomes 0.10 × 0.10 = 0.01; output 20,000/L and 2-log reduction. A particle metric says nothing by itself about dissolved salts, chemical toxicity, organism susceptibility or validated water-quality criteria.
Why: Credit requires multiplying residual fractions and identifying what was actually measured. An acceptable risk judgment needs contaminant-specific evidence and validated monitoring, not a visual impression.