Reverse osmosis: separating water and concentrating a remainder
By How things work · myAudience
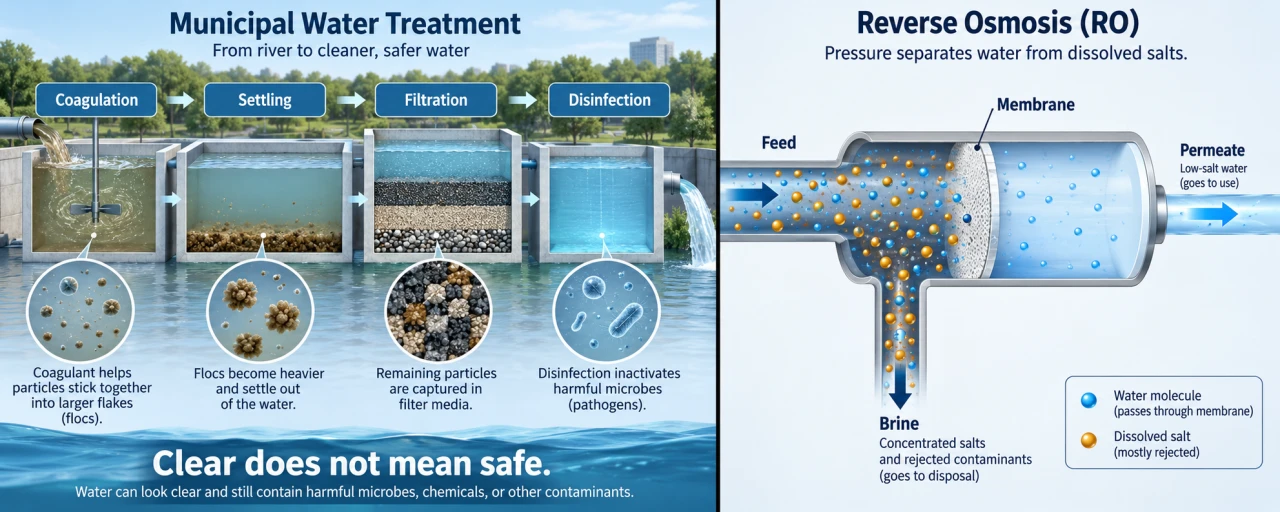
myAudience original imagegen teaching illustration; illustration, not a documentary photograph. · Original generated illustration; scientific and publication acceptance pending independent review.
Reverse osmosis: separating water and concentrating a remainder
A selective membrane permits water transport while strongly rejecting dissolved salts. Applied feed pressure exceeding the opposing osmotic effect drives net water toward a less saline permeate. This is not simply a sand filter with smaller visible holes. Dissolved ions and water interact with the membrane; selectivity is not perfect.
Feed separates into permeate and concentrated brine. The salt rejected from the product must go somewhere. Pretreatment protects membranes from deposits and fouling; a product-water test is still needed. The illustration separates the permeating stream from the brine retained on the feed side, avoiding a false picture in which all feed becomes fresh water.
Recovery R = Qp/Qf is a volume-flow fraction. At steady state, Qf = Qp + Qb; for a dilute constant-density teaching model, salt conservation is Qf cf = Qp cp + Qb cb, with concentration in kg/m³. Rejection 1 − cp/cf measures a different quantity from recovery. Raising recovery can concentrate the remainder even if rejection is unchanged.
Hydraulic power supplied to feed is Δp Qf. Electrical input is larger when pump efficiency is below one; energy recovery from the brine can reduce net input but is omitted here. Pressure selection, fouling, concentration polarization and brine management need separate models. A salt balance cannot certify drinkability or an actual membrane rating.
Use the right half of the plate: feed reaches the membrane, permeate passes to the right and brine leaves below on the feed side. Blue and gold icons distinguish conceptual water and dissolved salt; their counts are not a stoichiometric or concentration measurement. The mostly rejected legend does not mean perfect salt exclusion. The left treatment train addresses different barriers.
For discussion, desalination may expand water access while requiring energy and concentrated-remainder management. How should communities compare supply reliability, affordability and local ecological evidence? Do not treat either high recovery or low pump-only energy as a complete social decision.
Image: illustration, not a documentary photograph.
Worked example: Invented dilute feed: 1.0 m³/h at 5 kg/m³. Recovery 0.40; product concentration 0.10 kg/m³. Δp = 1 MPa, pump efficiency 0.75; no energy recovery. Find brine concentration and input per product volume.
Qp = 0.40 m³/h; Qb = 0.60 m³/h. Feed carries 5 kg/h, product 0.040 kg/h, brine 4.960 kg/h.
cb = 4.960/0.60 = 8.267 kg/m³. Rejection relative to feed = 1 − 0.10/5 = 98%, distinct from 40% recovery.
Qf = 1/3600 m³/s. Hydraulic power = 277.78 W; input = 370.37 W. In one hour input is 0.37037 kWh, or 0.9259 kWh per m³ of product.
Answer: Brine 8.267 kg/m³; 98% rejection; 0.9259 kWh/m³ product for the declared pump-only model.
Check your understanding: 1: Raise recovery to 0.60 with unchanged cf and cp; find cb. 2: Is higher recovery therefore free energy saving in a real plant?
Answer: Qb = 0.40 m³/h; brine salt = 5 − 0.60 × 0.10 = 4.94 kg/h, so cb = 12.35 kg/m³. Holding pressure/input fixed would reduce model input per product, but greater concentration changes osmotic opposition and fouling; those fixed assumptions need justification.
Why: Credit requires closing both flow and salt balances, using seconds for watt calculations and refusing to extrapolate a fixed-pressure toy model to real higher-recovery performance.