Compression ignition: why compressing air comes before useful work
By How things work · myAudience
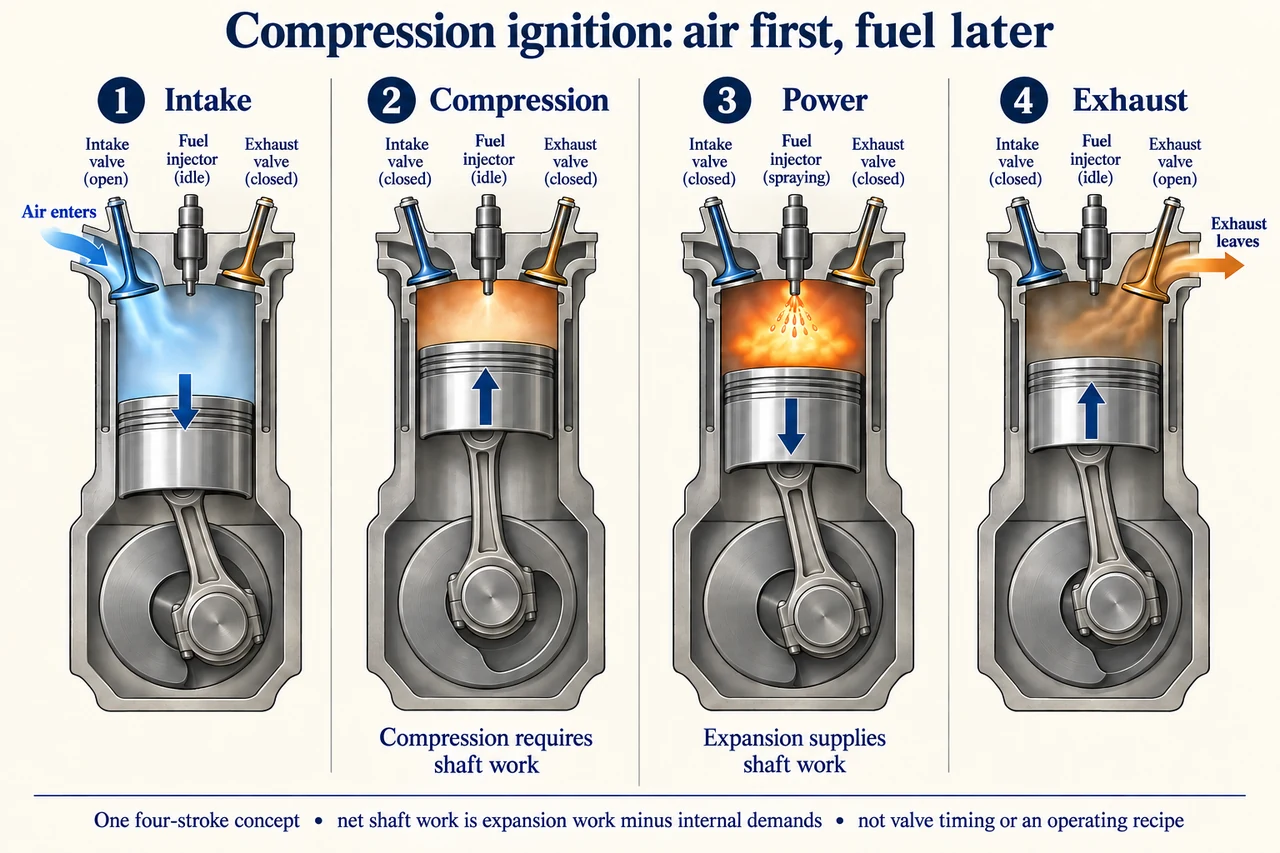
myAudience original rendered teaching illustration. Image: illustration, not a documentary photograph. · Operator-authored generated illustration; scientific model reviewed separately.
Compression ignition: why compressing air comes before useful work
A compression-ignition engine takes in air and compresses it before fuel is introduced into the hot compressed air. Combustion releases chemical energy and the expanding gases can drive a piston and crankshaft. This differs from the chosen spark-ignition comparison, where a spark initiates combustion of a prepared fuel-air mixture. Real modern injection architectures vary, and this four-stroke concept is not a valve-timing chart, fuel-system specification or description of every compression-ignition design.
Trace each illustrated stage separately. Intake shows the piston moving down with the intake valve open and air entering; compression moves the piston up with both valves closed. The power stage adds fuel through a distinct injector into the compressed air while both valves remain closed in the simplified model. Expansion drives the piston downward; exhaust moves it up while the exhaust valve opens. An injector is not a spark plug and not the intake valve. Real valve events can overlap and combustion extends over crank angle; the four pictures isolate functions rather than prescribing their exact timing. Connecting rods and crank positions are schematic and do not encode a precise angular trajectory.
Compression requires work from the rotating system: pressure does not rise without an energy transfer. Expansion can deliver more work than compression and the other internal demands consume, leaving net shaft work. A flywheel and other cylinders can help sustain rotation through strokes that do not themselves supply useful work. Higher compression is not an unlimited improvement; mechanical, thermal and combustion constraints all matter. Neither a hot-air illustration nor a compression ratio alone determines ignition behaviour, fuel compatibility or efficiency.
For an original event-count model, a four-stroke cylinder completes one cycle every two crankshaft revolutions. At 1,800 revolutions per minute it has 15 cycles per second. Six cylinders therefore have 90 cycles per second in total. Suppose each cycle supplies a fictional net indicated piston work of 1,000 J, already after its compression and gas-exchange work. Indicated power is 90 kW. If mechanical/internal auxiliary demands between that indicated boundary and the shaft total 20 kW, brake shaft power is 70 kW. Do not subtract compression work a second time from the already net indicated input.
For steady rotation, average shaft power equals average torque times angular speed. At 1,800 rpm the angular speed is 60π rad/s, so 70,000 W corresponds to approximately 371.4 N m average torque. This is not instantaneous cylinder torque. If a transfer model assumes 2,400 rpm, the same 1,000 J per cylinder cycle and 35 kW internal demand, indicated power becomes 120 kW but shaft power only 85 kW, with average torque about 338.2 N m. More cycles per second need not mean proportional usable power or greater torque; actual cylinder work and demands are not fixed with speed.
Compare engine service using more than a peak power number. Fuel consumption, particulate and nitrogen-oxide emissions, noise, maintenance, after-treatment effectiveness under real use, reliability and alternatives affect users and neighbouring communities. Compression ignition is an established mechanism, while proposed fuel or combustion innovations need evidence for the exact equipment and conditions. Historical vehicle counts and broad emissions-reduction claims are excluded. The calculation develops boundary reasoning, not engine tuning, fuel injection, emissions defeat or safe operation.
Image: illustration, not a documentary photograph.
Worked example: A fictional six-cylinder four-stroke engine turns at 1,800 rpm. Each cylinder delivers 1,000 J net indicated work per cycle, and mechanical/internal demands total 20 kW. Calculate cycle rate, brake power and average shaft torque.
Cycles per second per cylinder = 1800/(60 × 2) = 15; all six cylinders give 90 cycles/s.
Indicated power = 90 × 1000 = 90,000 W; brake shaft power = 90 − 20 = 70 kW.
Angular speed = 1800 × 2π/60 = 60π rad/s; average torque = 70,000/(60π) ≈ 371.4 N m.
Answer: 90 total cylinder cycles/s, 70 kW brake power and approximately 371.4 N m average torque under the given assumptions.
Check your understanding: In the stipulated 2,400 rpm transfer, indicated work per cycle stays 1,000 J while internal demand rises to 35 kW. Calculate brake power and torque. Why is the same-cylinder-work assumption insufficient evidence for real off-design performance?
Answer: Total cylinder cycle rate is 2400/(60 × 2) × 6 = 120/s; indicated power is 120 kW and brake power 85 kW. Angular speed is 80π rad/s, so average torque is 85,000/(80π) ≈ 338.2 N m. The assumed event work ignores changed breathing, injection, combustion and heat transfer with speed; actual performance needs measured or validated state-dependent data. Compression was already included in net indicated work.
Why: Declare boundaries, keep units consistent and distinguish an invented explanatory model from measured installation performance.