A mould gives shape; a process gives properties
By How things work · myAudience
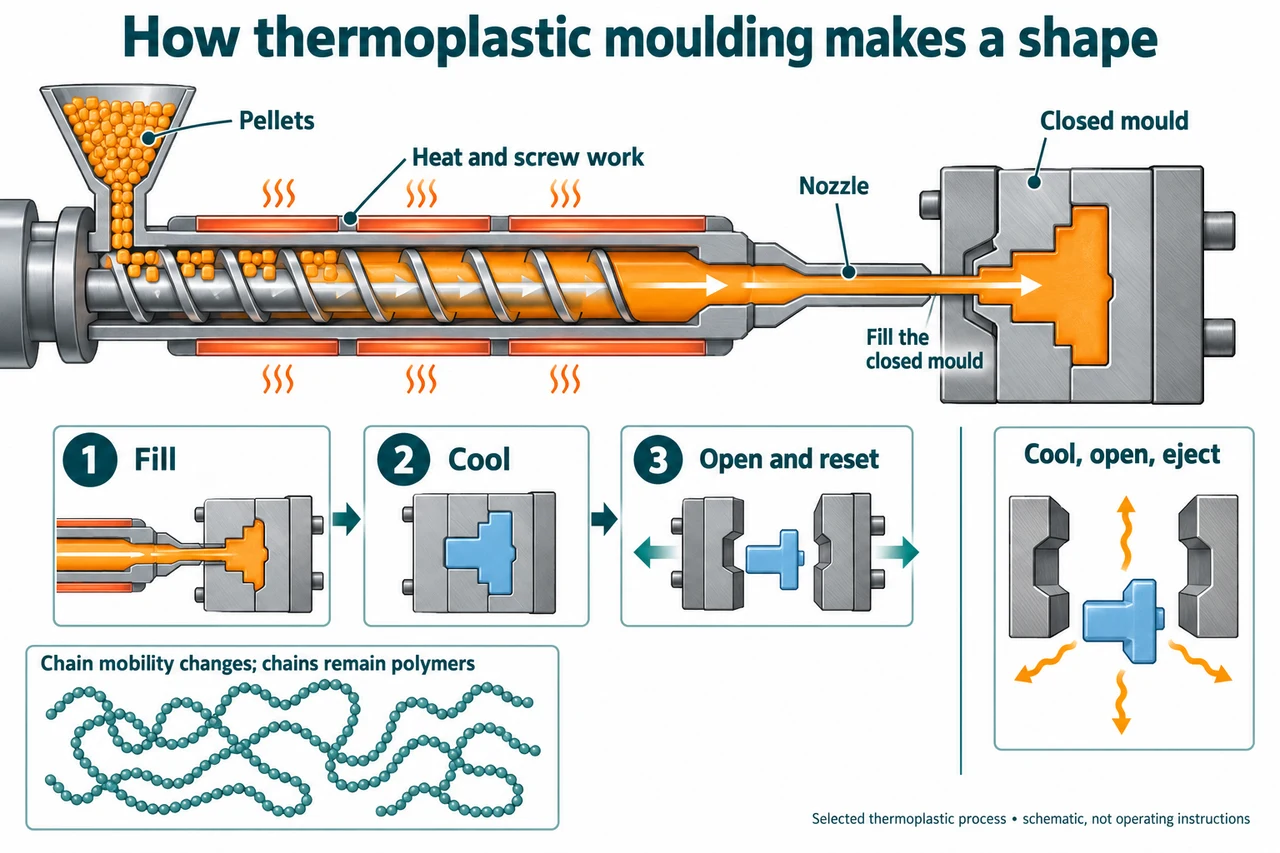
myAudience original rendered teaching illustration. Image: illustration, not a documentary photograph. · Operator-authored generated illustration; scientific model reviewed separately.
A mould gives shape; a process gives properties
A polymer is made of long molecules. The selected thermoplastic process shapes an already polymeric feedstock; it is not a picture of making the original polymer from monomers. Heat and mechanical work allow the material to flow into a closed mould, then cooling allows the shape to become sufficiently solid for removal. Melting does not mean that every chain becomes a small monomer again. This lesson concerns one shaping route, not the synthesis, processing or recycling of every plastic.
Follow the plate from pellets through the heated barrel and nozzle into the closed cavity. The lower panels are successive states: filling, cooling, then opening and resetting. The blue finished part is outside a separate open mould, not ejected through the walls of the closed one. The chain inset is a qualitative molecular idea; touching curves are neither measured entanglement counts nor connecting chemical bonds. Heat can leave a recently ejected part, but cooling occurs before ejection too. The drawing omits packing, detailed screw motion, cooling channels and control systems, so it supplies no machine-setting recipe.
NIST’s 2015 performance-model example separates filling, cooling and reset times; its present research programme stresses how composition and processing history affect structure and properties. That is a reason to distinguish a part’s visible shape from its verified performance. A simple factory arithmetic problem can count output, but cannot decide that cooling is adequate merely because an object comes out of a mould. Neither the archived model nor our illustration certifies a material, a current operating standard or a production line.
Consider an original serial-cycle model. A two-cavity mould takes 5 seconds to fill, 20 seconds for the defined cooling stage and 5 seconds to open, eject and reset. If these stages do not overlap, cycle time is 30 seconds. In one uninterrupted hour it completes 120 cycles and makes 240 parts before rejection. A fictional measured quality yield of 95% gives 228 accepted parts per hour. Calling 240 the useful output quietly counts 12 unacceptable parts as if they met the requirement. Yield is a fraction of output, not an extra fraction of operating time.
Now shorten cooling to 15 seconds while holding the other times fixed. The serial model gives a 25-second cycle, 144 cycles and 288 produced parts per uninterrupted hour. Suppose the changed process achieves only 75% accepted yield: useful output becomes 216 parts per hour, lower than 228 despite the faster cycle. The example does not establish that any real reduction in cooling causes that exact rejection rate. It demonstrates what happens when independently specified quality and speed must both enter a decision. The new process must exceed 228/288, about 79.167% accepted yield, to beat the old useful output under these assumptions.
If a report also states that the machine runs for only 80% of the scheduled hour, the original process averages 0.80 × 228 = 182.4 accepted parts per scheduled hour over many comparable hours; one cannot literally make a fraction of a part. Lost availability, speed and quality are different denominators. Our model omits overlapping operations, startup scrap, changing yields and downstream bottlenecks. Ask which denominator a claimed improvement uses, and what was measured. Reduced material waste and energy per accepted part can matter more than a headline cycle rate. Responsible comparison also considers worker protection, lifetime performance, collection and reprocessing evidence; a thermoplastic label alone does not prove that every local waste system can recycle the item.
Image: illustration, not a documentary photograph.
Worked example: A fictional two-cavity mould has serial fill/cool/reset times of 5/20/5 seconds and 95% accepted yield. A changed process uses 5/15/5 seconds and 75% yield. Assume an uninterrupted hour, no overlapping stages or other bottlenecks. Compare produced and accepted output.
Original cycle = 5 + 20 + 5 = 30 s. Cycles per hour = 3600/30 = 120; produced output = 120 × 2 = 240 parts/h.
Original accepted output = 240 × 0.95 = 228 parts/h. Changed cycle = 25 s; produced output = 3600/25 × 2 = 288 parts/h.
Changed accepted output = 288 × 0.75 = 216 parts/h, 12 fewer accepted parts/h despite 48 more produced parts/h.
Answer: The original gives 240 produced and 228 accepted parts/h; the faster cycle gives 288 produced but only 216 accepted parts/h in the stated model.
Check your understanding: What accepted yield must the changed process exceed to beat the original accepted output? If both processes have 80% availability over many scheduled hours, does their ordering reverse? A manager says a visible shape and a thermoplastic label prove unchanged properties and universal recyclability. Evaluate.
Answer: It must exceed 228/288 = 19/24 ≈ 79.167%; equality merely matches the old output. Multiplying both useful outputs by the same 0.80 gives 182.4 versus 172.8 accepted parts per scheduled hour, so the ordering does not reverse. These are long-run averages. Shape alone does not verify performance: composition and processing history still require appropriate evidence. Reprocessing also depends on material identity, contamination, collection and available methods, so the label is not a universal recycling guarantee.
Why: The denominator determines whether a figure describes cycle speed, produced output, accepted output or scheduled-time output. Keep the original model assumptions explicit; arithmetic cannot replace a controlled process-quality assessment.