A weld changes metal beyond the melted seam
By How things work · myAudience
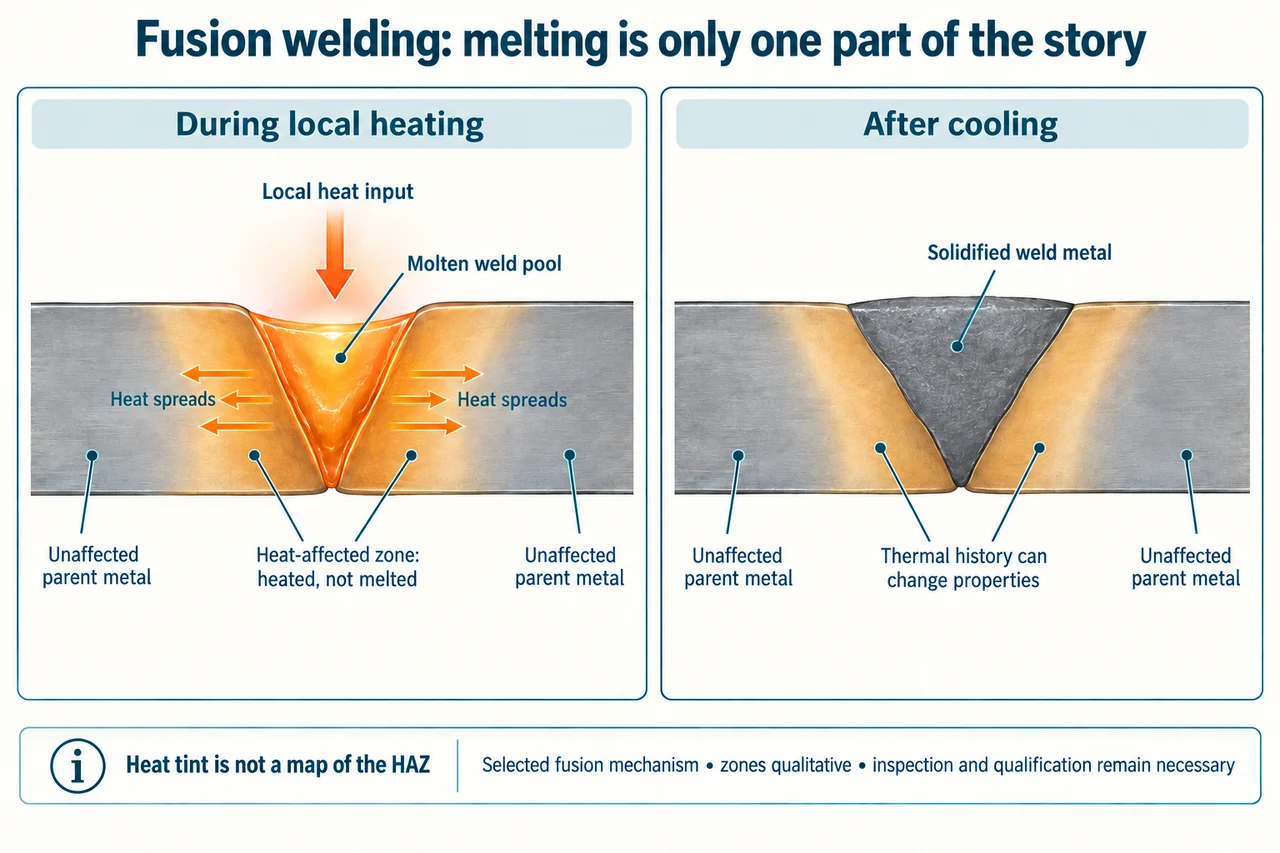
myAudience original rendered teaching illustration. Image: illustration, not a documentary photograph. · Operator-authored generated illustration; scientific model reviewed separately.
A weld changes metal beyond the melted seam
Fusion welding joins selected regions by melting and subsequent solidification; a filler may be used, but it is not the definition of fusion. This lesson follows a simplified cross-section of two metal edges, not a particular machine or approved procedure. Solidification makes a joined region where the pool was molten. Nearby parent metal can remain solid throughout yet experience a thermal history that changes its structure and properties. A neat visible seam therefore does not describe the whole joint. Solid-state joining routes need a different explanation and are not represented by this selected model.
Follow the image from left to right. The local heat-input arrow enters the orange molten pool, while outward arrows represent heat spreading into surrounding metal. The amber regions alongside the pool are the heat-affected zones, or HAZ: parent material heated but not melted. Their leader lines must end beside the pool, not in it. The right panel distinguishes solidified weld metal from those adjacent zones. Colour indicates conceptual regions, not a measured temperature or micrograph. The HAZ is also not the same thing as visible heat tint on the surface; TWI explicitly distinguishes those boundaries. Its extent needs appropriate evidence, not a ruler applied to these illustrative colours.
Why can unmelted material change? Different locations reach different temperatures for different durations, then cool under different conditions. Depending on the alloy and prior state, the result can include changed grains, phases or precipitates. These are possibilities to investigate, not universal outcomes for every metal. Nor is every HAZ necessarily weaker in every property. Strength, toughness, corrosion response and fatigue behaviour are different questions. The pool and parent material also constrain each other as the joint heats and cools. Nonuniform expansion and contraction can contribute to distortion and residual stress even when no external load remains. A drawing of a sound seam cannot establish those internal states.
A simple energy budget helps expose a common misleading comparison. If a fictional measurement reports 120 kJ actually delivered to a 60 mm length, the average delivered energy per length is 120/60 = 2 kJ/mm. It does not tell us the peak temperature, shape of the molten pool or time spent at a particular temperature. Delivering the same total with a different spatial distribution or time history can produce different results. Electrical input and heat delivered to the joint are also different boundaries, so do not silently substitute one for the other. This budget is an accounting example, not a machine setting, qualified heat-input range or recipe for welding.
For a separate idealised expansion calculation, let a freely expanding uniform 100 mm strip have a stipulated average coefficient α = 12 × 10⁻⁶ K⁻¹ over a uniform 400 K temperature increase. The linear model gives ΔL = α L ΔT = 0.48 mm. Double the original length and the expansion doubles to 0.96 mm; halve the temperature increase and it becomes 0.24 mm. The coefficient is an assumed average for this example, not a material certificate or a constant guaranteed across all temperatures. Crucially, this freely expanding strip is not a realistic temperature map of the welded joint. Its free expansion alone does not give constrained stress, plastic deformation, residual stress or an allowable load.
An honest comparison therefore asks what joint is needed, which materials and service conditions are involved, and what evidence qualifies the process and verifies the result. Appearance, average energy and a calculated free expansion each answer a narrower question. Appropriate inspection can include evidence beyond the surface, but no particular inspection is proven sufficient here. Repair may avoid replacing a larger assembly, yet a lifecycle claim must also count energy, consumables, rejected joints and service life. Worker exposure and safe professional practice matter alongside material efficiency. This conceptual lesson supplies no operating instructions and cannot qualify a structural joint or certify anyone to weld.
Image: illustration, not a documentary photograph.
Worked example: A fictional measurement finds 120 kJ delivered to a 60 mm seam. Separately, a free uniform strip starts at length 100 mm, has assumed average α = 12 × 10⁻⁶ K⁻¹ and warms uniformly by 400 K. Calculate the average energy per seam length and the strip’s free expansion. State what neither result proves.
Average delivered energy per length = 120 kJ / 60 mm = 2 kJ/mm. The numerator is heat delivered to the joint, not an unspecified electrical input.
For the separate free strip, ΔL = α L ΔT = (12 × 10⁻⁶ K⁻¹) × 100 mm × 400 K = 0.48 mm. Final idealised length is 100.48 mm.
The energy average contains no time or spatial temperature distribution. The strip model permits free expansion and assumes a uniform temperature and average coefficient; it does not calculate a restrained weld stress.
Answer: 2 kJ/mm average delivered energy and 0.48 mm idealised free expansion. Neither number establishes seam quality, HAZ properties, residual stress or a safe load.
Check your understanding: Two joints receive the same 120 kJ over 60 mm, but the heating histories differ. Must their properties match? For the free-strip model, find expansion for a 200 mm strip and for the original 100 mm strip heated by only 200 K. Would a narrow band of surface heat tint prove the HAZ is equally narrow?
Answer: No: equal average energy per length leaves spatial distribution and temperature–time history unspecified, so matching properties do not follow. With the same stipulated α, a 200 mm strip heated by 400 K expands 0.96 mm; the 100 mm strip heated by 200 K expands 0.24 mm. These are free, uniform-strip results, not predictions of weld distortion or stress. Heat tint is an oxidation-related surface observation and is not a direct map of the unmelted material altered by thermal history.
Why: Identify the boundary and assumptions of each measurement or model. Do not convert an energy average, surface colour or free-expansion calculation into an unsupported qualification claim.