Turbofan thrust: count both momentum streams
By How things work · myAudience
myAudience original generated educational illustration · Original commissioned illustration
Turbofan thrust: count both momentum streams
A jet engine accelerates a fluid, and the corresponding reaction force acts on the engine. It does not need to push against a solid wall behind the aircraft. NASA’s thrust explanation connects force to momentum change per unit time and includes a pressure-area term when the exit pressure differs from the surroundings. A turbofan has both a core stream and a bypass stream; their contributions must be counted together. This lesson uses an intentionally simplified, equal-pressure example to test the reasoning, not to predict an actual engine’s rated thrust or fuel use.
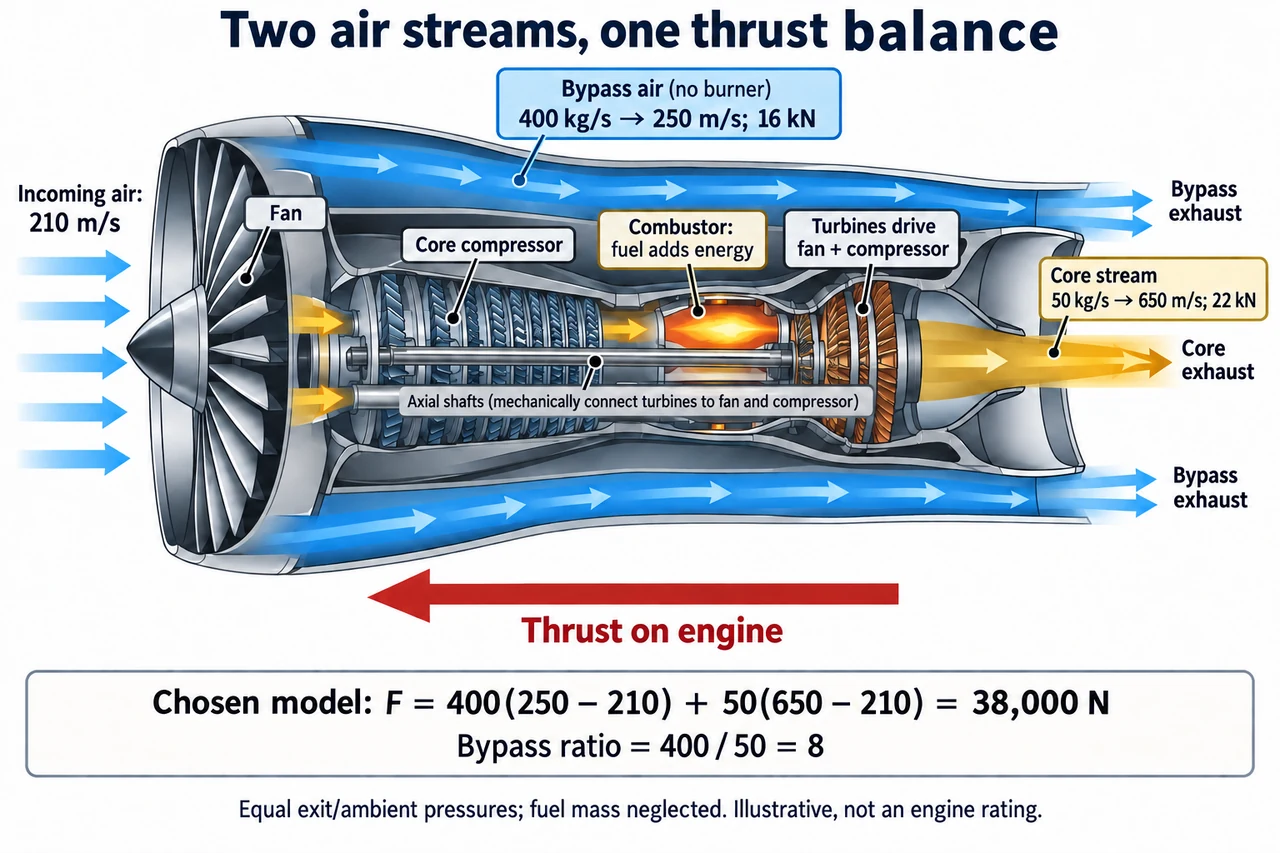
Read the cutaway from left intake to right exhaust. Air passing through the core is compressed, receives energy through combustion and expands through turbines and the nozzle. The turbines supply mechanical work to the compressor and fan through shafts. Bypass air goes through the fan and around the core, not through the combustor. The blue and warm-coloured routes keep those roles separate. Air arrows point rearward in the engine’s frame; the large reaction arrow points toward the intake, forward on the engine. The schematic is not a manufacturable shaft, blade or fuel-system layout.
Momentum is mass multiplied by velocity. A steady stream delivering mass at a rate of kilograms per second carries momentum at a rate of kg·m/s², which is newtons. For one stream with equal entering and leaving mass rates and matched exit/ambient pressures, thrust magnitude in the chosen axial convention is F = ṁ(Vexit − Vin). With added fuel, changed mass rates or unmatched exit pressure, the more general expression uses outgoing minus incoming momentum flux and the pressure-area contribution. These terms cannot be discarded merely because a smaller formula is easier to remember.
Use the plate’s original equal-pressure, negligible-fuel-mass model. Incoming air speed is 210 m/s. Bypass mass flow is 400 kg/s and leaves at 250 m/s, contributing 400 ×(250 − 210) = 16,000 N. Core mass flow is 50 kg/s and leaves at 650 m/s, contributing 50 ×(650 − 210) = 22,000 N. Total chosen thrust is 38,000 N, or 38 kN. The bypass ratio is 400/ 50 = 8, a mass-flow ratio rather than a speed ratio or a thrust ratio. Despite its lower exit speed, the bypass stream contributes substantial force because its mass flow is much larger.
Keep the reference frame and comparison conditions explicit. A speed measured relative to the ground cannot simply be combined with an inlet speed measured relative to the engine. Holding the two plate mass flows and exit speeds fixed while changing the chosen incoming speed from 210 to 230 m/s would yield 400 × 20 + 50 × 420 = 29,000 N. That is a sensitivity calculation, not a claim that a real engine keeps all other variables fixed as an aircraft accelerates. Mass flow, pressure, temperature, controls and nozzle conditions can change together; the algebra alone does not model them.
Thrust is not power or efficiency. As a separate steady-flight accounting quantity,38 kN acting along a flight speed of 210 m/s corresponds to an aircraft-useful thrust power F V = 7.98 MW. That does not equal fuel input or shaft power inside the engine. The kinetic energy left in moving exhaust, heat and other outputs remain part of the energy balance. Accelerating a larger mass through a smaller speed increase can alter the distribution of useful power and exhaust kinetic energy, but an unqualified assertion that any higher bypass ratio is always better would omit weight, drag, speed, noise and design constraints.
A transport decision also concerns people who do not take the flight. Noise, local emissions, global climate effects, resource use and access to travel are different outcomes; better fuel use per passenger does not by itself determine total demand or total impact. Reliability depends on engineering, maintenance and verified operating limits, not a pleasing cutaway. Compare actual lifecycle and service data at matched conditions, and distinguish established turbofan operation from proposals for alternative fuels or propulsion. The diagram supplies no assembly, test-run or aircraft-operation instructions.
Image: illustration, not a documentary photograph. Core and bypass routes and chosen momentum values show a bounded mechanism with equal exit/ambient pressures and neglected fuel mass, not a physical working layout or engine rating.
Worked example: In an invented matched-pressure turbofan model, inlet speed is 200 m/s. Bypass flow is 300 kg/s with exit 260 m/s; core flow is 40 kg/s with exit 600 m/s. Neglect fuel mass. Find both thrust terms, total thrust, bypass ratio and aircraft-useful thrust power at 200 m/s.
Bypass term = 300 ×(260 − 200) = 18,000 N; core term = 40 ×(600 − 200) = 16,000 N.
Total thrust = 34,000 N = 34 kN; bypass ratio = 300/ 40 = 7.5.
Useful thrust power at the stated aircraft speed = 34,000 × 200 = 6,800,000 W = 6.8 MW; this is not fuel power or thermal efficiency.
Answer: The bypass and core terms are 18 and 16 kN, totaling 34 kN; bypass ratio is 7.5 and useful thrust power at 200 m/s is 6.8 MW in the model.
Check your understanding: For the plate model, retain mass flows and exit speeds but use incoming speed 230 m/s. Calculate thrust. If a separate exit has pressure excess 10 kPa over area 0.20 m², find that added pressure term. Explain why neither calculation proves a real thrust-versus-speed curve or fuel efficiency.
Answer: Chosen momentum terms become 400 ×(250 − 230) = 8,000 N and 50 ×(650 − 230) = 21,000 N, totaling 29 kN. The separate pressure term is 10,000 Pa × 0.20 m² = 2,000 N, or 2 kN, under its declared conditions. Real mass flow, pressures and temperatures may change with operating conditions, and neither example supplies fuel energy input or a complete engine model.
Why: Trace forces or energy through a declared boundary, check units and assumptions, and justify why a chosen calculation is not a rated performance or safe operating prescription.