Pulse oximetry: a light ratio needs validated interpretation
By How things work · myAudience
myAudience original generated educational illustration · Original commissioned illustration
Pulse oximetry: a light ratio needs validated interpretation
A pulse oximeter estimates peripheral arterial oxygen saturation using an optical signal; it does not count oxygen molecules directly. Light interacts with tissue, blood and other absorbers before reaching a detector. Oxygenated and deoxygenated haemoglobin have different absorption at selected wavelengths, so commonly used red and infrared channels contain complementary information. The signal also varies with the pulse. FDA treats the result as an estimate with important limitations, rather than a complete assessment of how a person is doing. This mechanism lesson supplies original fictional detector values, not a clinical decision rule.
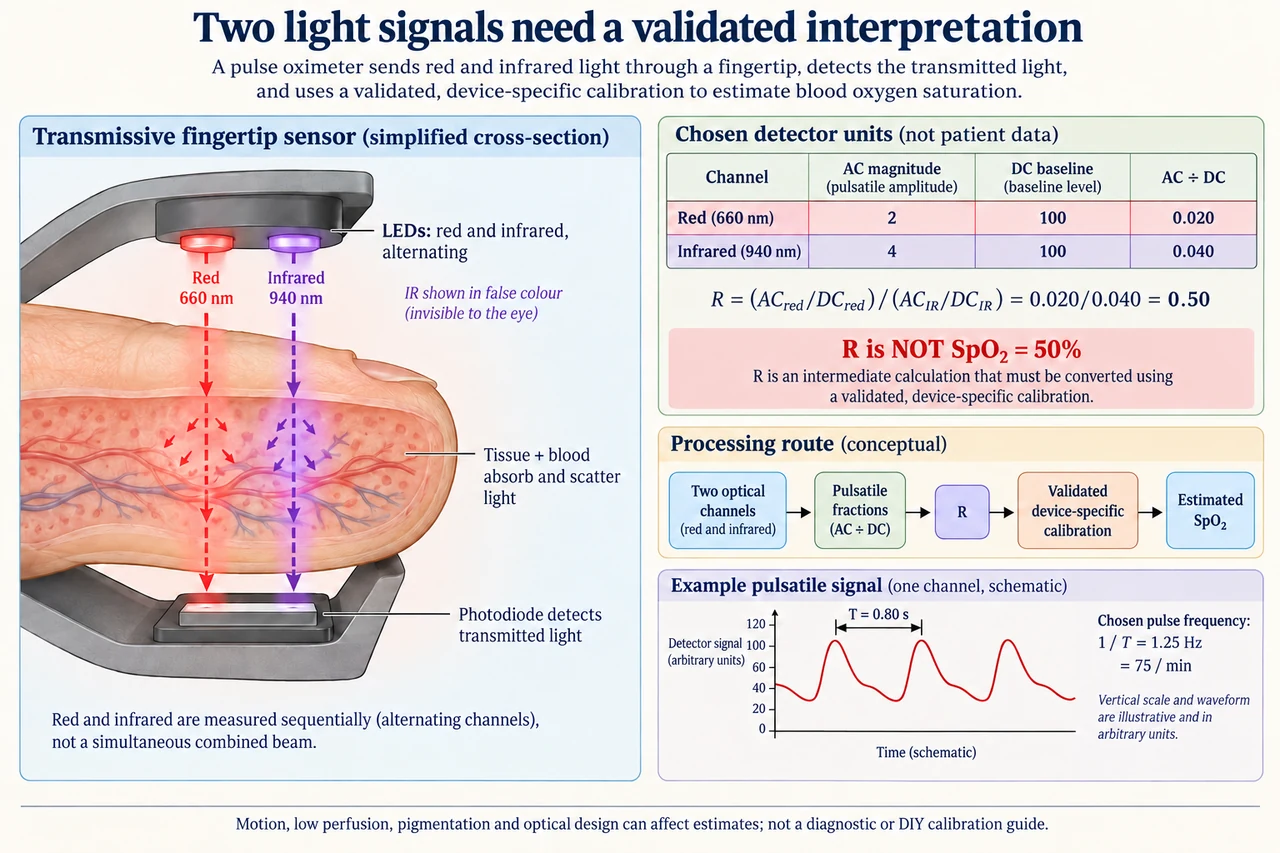
The image selects a transmissive fingertip geometry: light sources and detector lie on opposite sides of the tissue. Reflective geometries instead put them on the same side and collect scattered returning light, so the clip picture is not a universal wearable layout. Red around 660 nm and infrared around 940 nm are a common illustrative choice; infrared is drawn purple so its route can be seen, although those photons are not visible purple light. The channels are sampled separately rather than requiring simultaneous emission. Photodiodes detect light that arrives, not only light from arterial blood and not oxygen itself. Ambient illumination and direct optical leakage can contaminate the route.
Separate a relatively steady baseline, conventionally called DC, from the magnitude of a pulsatile component, called AC. In a bounded quiet-signal model, pulsating arterial volume contributes strongly to the varying part, while tissue and nonpulsatile components contribute to the baseline. This distinction is not a way to physically extract a pure arterial sample: motion, contact changes, other changing absorbers and electronics can also vary the signal. Greater blood volume can reduce raw transmitted intensity through absorption, while a displayed processed waveform may have an inverted sign. Here AC means positive amplitude magnitude, and no systolic-versus-diastolic sign is inferred from the stylised graph.
Normalising each channel’s pulsatile amplitude by its own baseline partly removes scale differences. For the image’s fictional detector units, red AC/DC is 2/100 = 0.020 and infrared AC/DC is 4/100 = 0.040. The ratio of those fractions, R = (ACred/DCred)/(ACIR/DCIR), is 0.50. R is dimensionless but is not an oxygen saturation of 50%. A conversion from R to estimated SpO₂ requires a validated device-specific relationship against appropriate reference measurements. Ideal absorption reasoning alone cannot establish clinical accuracy through real scattering tissue, variable spectra and geometry. No invented straight-line calibration or clinical lookup table is provided.
This model makes a useful sensitivity exercise without claiming it validates a device. If the red channel’s AC and DC both double to 4 and 200 while the infrared values stay unchanged, the red fraction remains 0.020 and R remains 0.50. Multiplicative gain alone cancels under these assumptions. If an unremoved baseline contribution instead makes red DC 120 while AC remains 2, its fraction becomes 0.01667 and R falls to about 0.4167. That change could arise without any change in the chosen underlying pulsatile amplitude. Neither result establishes a new oxygen saturation; it demonstrates why signal quality and the reconstruction model matter.
Pulse timing and saturation are different inferences. The plate’s stylised signal has a chosen interval of 0.80 s between equivalent neighbouring peaks, giving a repetition frequency of 1.25 Hz or 75 per minute. These are fictional values, not healthy-versus-unhealthy thresholds. A repeating motion disturbance could also create peaks, and missing or distorted pulses may complicate a rate estimate. A clean-looking graph is not a certificate that its fluctuations are physiological. Signal filtering, ambient-light handling and quality flags can help, but cannot guarantee that all artefacts or person-specific biases vanish. Software should communicate uncertainty rather than substitute a reassuring number when evidence is inadequate. The plotted waveform is a separate schematic timing example, not a calibrated trace of the detector values in the table.
FDA identifies factors including poor circulation, skin pigmentation, skin thickness, temperature and nail polish that can affect readings; movement and contact artefacts add measurement challenges. Fair evaluation requires evidence across the people and conditions for which a device is intended, with objective pigmentation considerations rather than treating race as an optical property. A validation average can conceal unequal errors between groups, and correction claims need new evidence rather than a cosmetic label. The FDA page retrieved for this lesson describes a January 2025 draft guidance as draft; this lesson does not claim that draft is a final standard. Medical concerns should be assessed with clinical context and professional care, not this fictional ratio.
Image: illustration, not a documentary photograph. The finger route is a simplified transmissive optical model; the positive AC magnitudes, common detector-unit baseline and pulse interval are invented teaching data. The processing route explicitly requires validated calibration before estimated SpO₂. Nothing shown is a patient reading, clinical operating threshold, DIY calibration protocol or promise of accuracy across skin tones.
Worked example: Use fictional red AC = 3 and DC = 150, infrared AC = 5 and DC = 125. Calculate each pulsatile fraction and R. If red AC and DC both double, what changes? If red DC alone becomes 180 with its AC still 3, recompute R. For a separate clean chosen period of 0.75 s, calculate repetitions per minute without assigning a clinical category.
Red fraction = 3/150 = 0.020; infrared fraction = 5/125 = 0.040. R = 0.020/0.040 = 0.50.
Doubling red AC and DC gives 6/300 = 0.020, so R remains 0.50 in the pure-gain model.
Red DC alone at 180 gives 3/180 = 0.01667, so R ≈ 0.4167. A period of 0.75 s gives 60/0.75 = 80 repetitions per minute; no clinical diagnosis follows.
Answer: The original R is 0.50, remains unchanged under proportional red gain, and becomes approximately 0.4167 under the separate baseline change. The chosen clean period gives 80 per minute. None is a validated saturation or clinical conclusion.
Check your understanding: A learner calls the plate’s R = 0.50 an oxygen saturation of 50% and treats every AC peak as arterial blood. Correct both statements. If infrared AC becomes 2 while its DC remains 100 and red stays 2/100, what R follows and what evidence is still needed?
Answer: R is an optical ratio, not a saturation percentage. AC can contain motion/contact and other artefacts as well as pulsatile physiological information. The changed fractions are both 0.020, so R = 1.0. A device-specific validated relationship, appropriate reference evidence, signal-quality assessment and clinical context remain necessary; no saturation or diagnosis can be assigned from this fictional table.
Why: Explain the measurement boundary and assumptions, calculate independently, and distinguish an illustrative signal from a validated clinical estimate.