Pasteurisation: a flow average cannot prove every parcel was treated
By How things work · myAudience
myAudience original generated educational illustration · Original commissioned illustration
Pasteurisation: a flow average cannot prove every parcel was treated
Pasteurisation is a controlled treatment intended to reduce relevant harmful microorganisms in a food under product-specific conditions. Heating something briefly or obtaining a warm average reading is not equivalent to a validated process. FDA describes milk pasteurisation as requiring designed equipment and a specified temperature-time exposure, within a wider system of handling and testing. Ordinary pasteurisation should not be confused with sterilisation, aseptic processing or guaranteed shelf stability. Different products and organisms need different evidence. This lesson explains residence-time reasoning and heat recovery with fictional engineering values; it supplies no treatment temperature, safe processing recipe, microbial endpoint or permission to improvise a food plant.
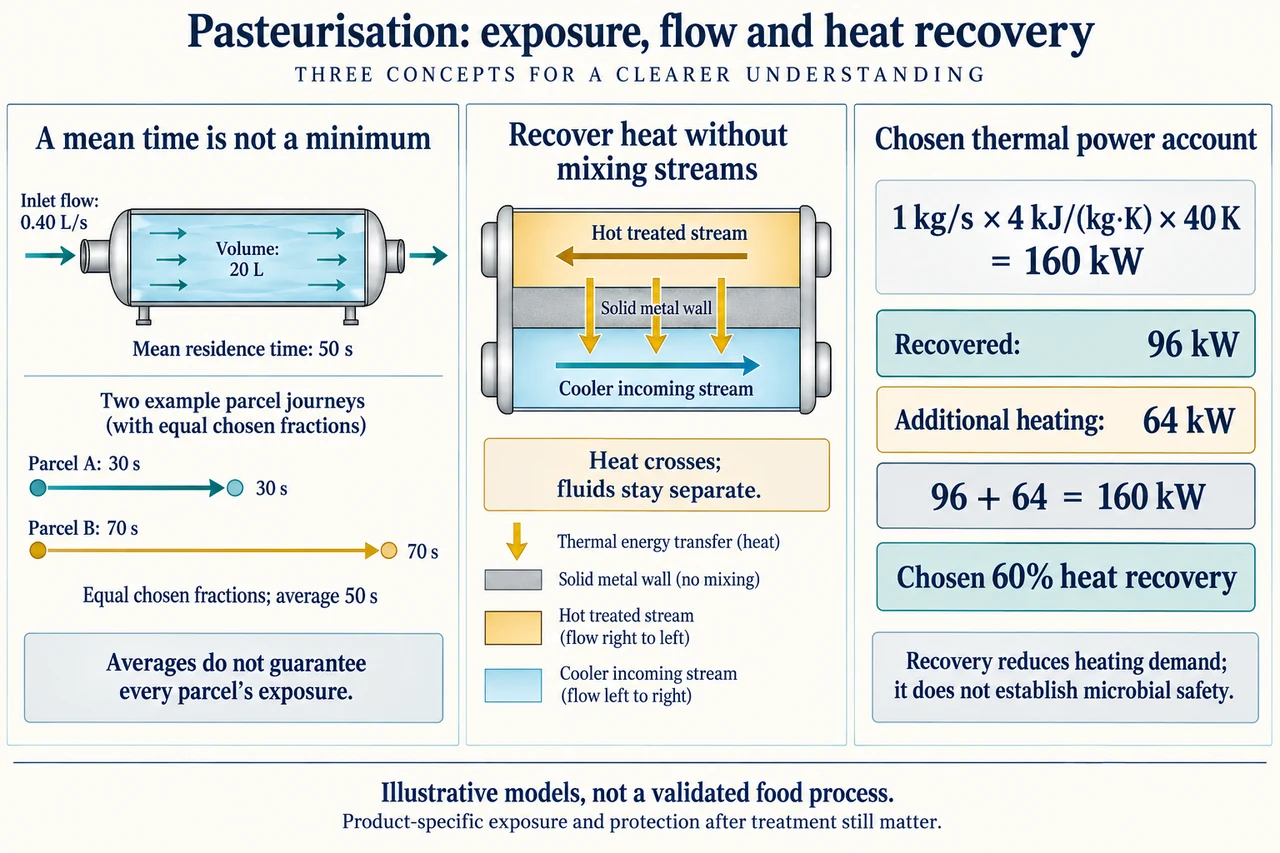
The left panel starts with an abstract filled flow volume V = 20 L and steady volumetric throughput q = 0.40 L/s. Dividing gives a mean residence time V/q = 50 s. Units make the result clear: litres divided by litres per second give seconds. Under an ideal plug-flow model, with a single fully active volume and uniform progress, every parcel could have that transit time. A real system may instead have a distribution because of velocity profiles, bypasses, stagnant regions or mixing. The diagram therefore places the two parcel journeys outside the volume rather than drawing an actual bypass plant. They illustrate the limitation of an average; they are not a validated pasteuriser layout.
Suppose equal chosen fractions spend 30 s and 70 s in an exposure region. Their weighted mean is 50 s, but half have the shorter exposure. A mean target alone cannot establish a minimum. A second distribution with equal fractions at 45 s and 55 s has the same mean and a different short-exposure tail. Which is acceptable cannot be decided here, because no product-specific exposure criterion or temperature history is provided. A treatment assessment needs the relevant shortest or otherwise limiting validated exposure, not just an arithmetic mean. A sensor reading at one point may also differ from a parcel's full temperature trajectory; passage time and thermal exposure are related but distinct quantities.
This distinction can be derived without borrowing a microbial threshold. For a hypothetical first-order inactivation model at an unspecified fixed condition, assume dN/dt = −kN, meaning the instantaneous reduction rate is proportional to the surviving population. Integrating at constant k gives survivor fraction exp(−kt), where k is a chosen rate constant. Mixing streams would give the weighted average of their survivor fractions, not the survivor fraction evaluated at the weighted average time. Choose k = 0.02 s⁻¹ solely for mathematical comparison: equal 30 s/70 s paths give[exp(−0.6)+exp(−1.4)]/2≈0.3977, whereas uniform 50 s gives exp(−1)≈0.3679. The faster fraction raises aggregate survivors even though the mean matches. This is a fictional sensitivity example, not a measured organism resistance, food-safety limit or clinical process. Resistance, matrix and temperature variation can defeat this simple equation.
The middle panel shows regenerative heat recovery. A hot treated stream and a cooler incoming stream travel in separate channels on opposite sides of a wall; thermal energy crosses the wall while the intended fluid paths remain separate. Recovered heat prewarms the incoming stream and partly cools the outgoing one, reducing external heating and cooling demand. The Tetra Pak manufacturer handbook explains this established arrangement along with separate final heating, holding and cooling stages. That account is used only for the mechanism, not as a current legal specification or a promise about every machine. A leak or an unintended cross-connection is a contamination issue, not a desirable way to recover more heat.
The right panel is a separate fictional thermal-power account. For steady mass flow 1 kg/s, chosen specific heat 4 kJ/(kg·K) and temperature rise 40 K, sensible heating duty isṁcΔT = 160 kJ/s = 160 kW. Suppose recovery supplies 96 kW, or 60% of that chosen duty; additional heating must then supply 64 kW before any losses. The same 96 kW leaves the hot stream in the ideal exchanger account: it is not new energy. Temperature-rise unitsK and°C are equivalent increments here, but the chosen 40 K rise says nothing about an actual treatment temperature. Doubling mass throughput doubles duty if c and the rise are unchanged; the existing exchanger may not preserve its chosen recovery fraction at the higher flow.
Process controls connect measurements to physical routing. Established continuous systems use monitoring and flow diversion so inadequately treated product does not simply continue to the same destination. Flow, sensing, heat-transfer surfaces and separation between untreated and treated material all need validation together. Holding-volume calculations alone cannot establish performance, and fouling can alter heat transfer and the distribution of temperatures. After treatment, contamination or unsuitable storage creates new risks; the earlier heat exposure does not provide permanent protection against every later event. Shelf stability requires its own suitable process and packaging evidence, not an inference from a regenerative heat exchanger or a product looking unchanged.
The engineering goal combines protection with sensible use of energy, water and materials, while retaining the required product quality. Recovering energy can reduce operating demand, but it cannot justify exposing a fast-moving fraction inadequately or bypassing failure investigation. Small producers need access to competent validation and maintainable equipment; a cheap chart should not transfer unacknowledged risk to consumers or workers. The image's parcel lines explain a mean-versus-minimum question, the wall illustrates separation and the numbers show a heat account. None is a copied plant blueprint, clinical threshold or food-processing instruction. Full microbiological validation, equipment control design, regulations, quality testing and other preservation methods remain separate topics.
Worked example: Use a new abstract filled volume 12 L at steady flow.30 L/s. Find mean residence time, then repeat after throughput doubles with volume unchanged. Compare a chosen equal-fraction 20 s/60 s distribution with uniform 40 s under hypothetical k = 0.025 s⁻¹. In a separate thermal account, ṁ = 0.8 kg/s,c = 3.5 kJ/(kg·K),ΔT = 30 K and recovered fraction 50%. Find total duty and additional heating before losses.
Mean time is 12/0.30 = 40 s. At.60 L/s it becomes 20 s, assuming the same active filled volume. This is not a guarantee of minimum parcel exposure or a product-specific criterion.
Equal 20 s/60 s paths give[exp(−0.5)+exp(−1.5)]/2≈0.41483. Uniform 40 s gives exp(−1)≈0.36788. The shorter-exposure tail increases the chosen survivor fraction; neither establishes actual food safety.
Thermal duty is.8 × 3.5 × 30 = 84 kW. Chosen 50% recovery contributes 42 kW, leaving 42 kW additional sensible heating before losses. This is separate from the residence/survival model and specifies no operating temperature.
Answer: The mean transit times are 40 s and 20 s. Chosen mixed survivor fraction is about.41483 versus.36788 for uniform 40 s. The separate heating duty is 84 kW with 42 kW recovered and 42 kW additional; none validates a food process.
Check your understanding: Does recovering 60% of the sensible heating duty prove 60% microbial reduction or a 60% safe-process rating? Why can identical mean residence times have different survivor fractions? If the plate's throughput doubles while specific heat/rise/recovery fraction are artificially held fixed, what happens to total and additional heating duty?
Answer: Heat recovery and microbial reduction measure different mechanisms and cannot be equated. Nonlinear survival averaged over unequal parcel times differs from survival at their mean; limiting exposure also matters independently of this aggregate model. Under the explicitly fixed assumptions, duty doubles to 320 kW and additional heating to 128 kW; a real exchanger need not retain the same recovery fraction at higher flow, and no safety outcome follows.
Why: Explain the energy or contamination boundary, calculate the chosen model with units, justify transfer and distinguish illustrative reasoning from clinical validation.