Flood management: storage changes timing, not conservation
By How things work · myAudience
myAudience original generated educational illustration · Original commissioned illustration
Flood management: storage changes timing, not conservation
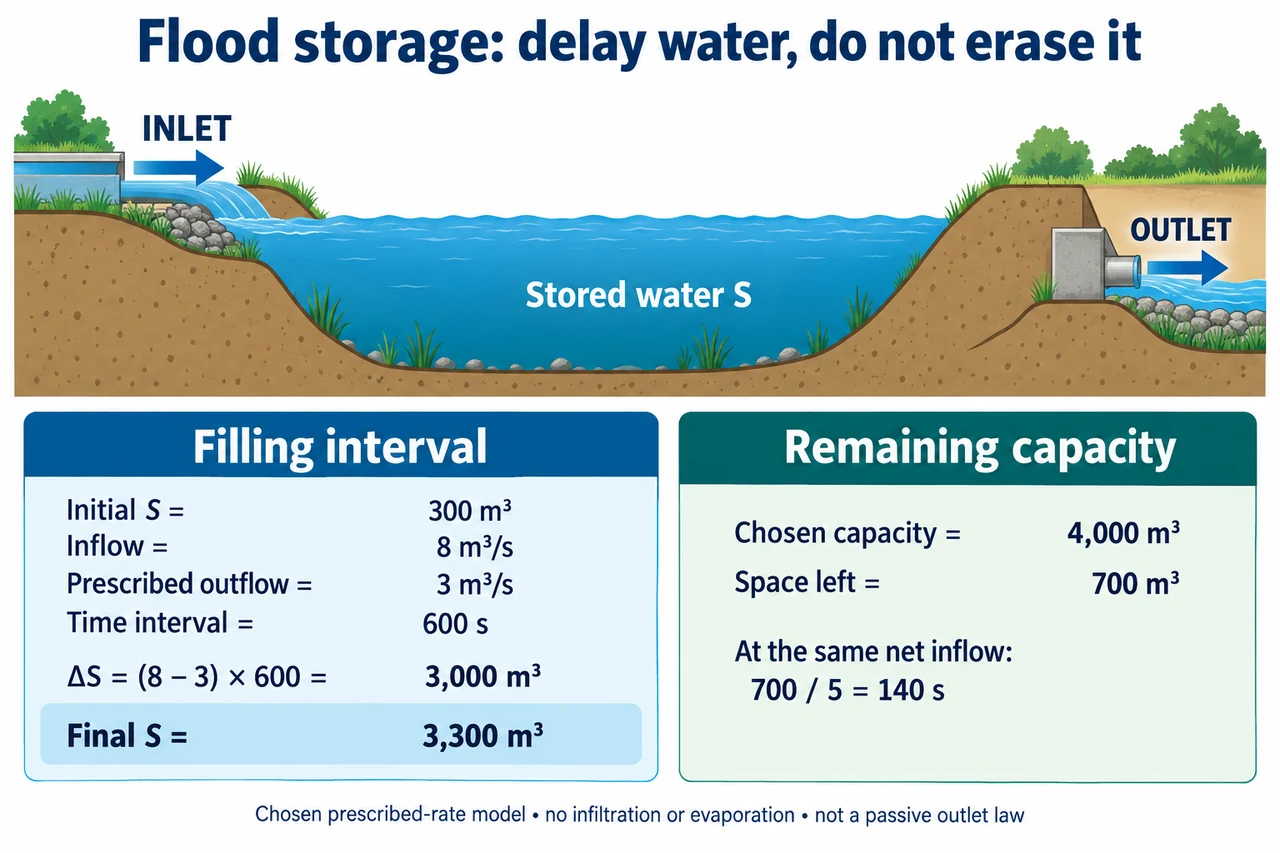
A detention basin temporarily holds water that would otherwise continue downstream sooner. Storage changes the timing of a flow; it does not automatically eliminate the water or guarantee that nobody floods. The image shows an inlet, a stored-water volume and an outlet as a symbolic control volume rather than an engineering design. Water may also infiltrate, evaporate or leave by additional routes in a real system. Those terms must be accounted for when relevant. A barrier that prevents a particular flood route, a pump that transfers water and a basin that delays runoff are different mechanisms, even when they form parts of the same protection scheme.
For a constant-density water account, change in stored volume equals total entering volume minus total leaving volume. Write dS/dt = I − O when other terms are omitted: S has units m³ while I and O are rates in m³/s. Over a time interval, integrate the difference rather than subtracting two isolated peak rates and treating the result as a volume. In the image’s chosen constant-rate interval, I = 8 m³/s and prescribed O = 3 m³/s for 600 s. Net accumulation is 5 m³/s, so storage increases by 3,000 m³. Starting at 300 m³ gives 3,300 m³ at the interval end. Every number is a fictional teaching assumption, not a measured basin or safe release instruction.
The chosen storage ceiling is 4,000 m³, leaving 700 m³ after that interval. If the same net accumulation continues, the remaining space is exhausted in 700/5 = 140 s. A calculation that continues increasing the stored volume beyond the ceiling while ignoring every extra route has violated its own boundary conditions. If a subsequent conceptual interval reaches the ceiling, additional water must be accounted for through a specified overflow route, another storage area or a changed inflow/outflow condition. Whether any actual overflow is safe depends on physical geometry and exposed people and assets, not on this volume balance. The image deliberately contains no proposed structure dimensions.
Now let the chosen inflow fall to 1 m³/s while prescribed outflow remains 3 m³/s, with other terms still omitted. Storage decreases at 2 m³/s; 3,300 m³ would reach zero after 1,650 s under that piecewise assumption. It cannot continue to become negative. At exhaustion, the outflow or another boundary condition must change. Nor does delaying discharge necessarily reduce the total discharged water over a complete event: if initial and final storage match and no other route operates, total outflow volume equals total inflow volume. Peak reduction and volume removal are separate claims. Infiltration can change a volume account, but detention alone is not an unexplained sink.
Prescribed outlet flow is useful for learning continuity, but it is not a passive outlet law. An actual outlet can depend on upstream level, downstream level, geometry, obstruction and other conditions. USACE’s technical reference distinguishes specified release from storage–discharge routing, and notes that a simple upstream-controlled outflow relationship is inappropriate when downstream backwater controls the outlet. The water surface drawn here is qualitative, not a calibrated elevation–storage curve. A chosen constant outlet cannot be justified merely by drawing a pipe. A credible hydraulic analysis would couple conservation with the relevant physical relationship and initial conditions; this lesson supplies the first part only.
Initial storage matters as much as nominal capacity. Suppose the same 600 s filling interval begins with 1,500 m³ rather than 300. Unconstrained accounting predicts 4,500 m³, which exceeds the chosen ceiling by 500 m³. Remaining space initially is only 2,500 m³, so the ceiling is reached after 500 s at the chosen net rate. This is why an empty-basin assumption cannot silently stand in for a partly filled basin before a second storm. Infiltration performance may also change with groundwater and surface conditions. NOAA’s stormwater guidance discusses high groundwater and coastal conditions as limitations, rather than treating every green feature as equally effective in all events.
A downstream assessment needs timing and receiving conditions, not only one basin’s maximum storage. A delayed release may overlap a tributary peak or encounter a high downstream water level, so local attenuation is not by itself proof of reduced risk everywhere. Conveyance transfers water rather than creating storage, and pumping requires power and a destination able to receive the discharge. Flood warnings, accessible evacuation, land-use decisions and infrastructure maintenance address different parts of risk. Forecast uncertainty and events exceeding assumptions remain possible. No rainfall frequency, evacuation advice, emergency operation or permissible discharge rate is inferred from the fictional numbers in this plate.
Fair flood management asks who receives the protection and who bears displaced water, construction costs or relocation pressures. A project that reduces one neighbourhood’s exposure while shifting it to another needs more than an aggregate benefit label. Nature-based approaches can add habitat and amenity, but their suitability still depends on site conditions and long-term care. The image’s inlet and outlet explain a conserved-volume account, and its remaining-capacity card makes the limit visible before claiming success. Actual design must evaluate failures, extremes, drainage and affected communities together. This bounded storage mechanism is part of a broader family; complete hydraulic design, ecological assessment and full risk objectives remain open.
Worked example: For a chosen constant-rate water account, initial storage is 500 m³, ceiling 5,000 m³, inflow 12 m³/s and prescribed outflow 4 m³/s for 400 s. Find final storage and remaining space. Determine the time to reach the ceiling if the same rates continue. Then use inflow 2/outflow 4 from that calculated final storage and find time to reach zero, explaining the required boundary change.
Net accumulation is 8 m³/s. Over 400 s, increase is 3,200 m³; final storage is 3,700 m³.
Remaining space is 1,300 m³. At 8 m³/s net accumulation, it lasts 162.5 s more. An unmodelled overflow cannot be ignored after that point.
From 3,700 m³ with inflow 2/outflow 4, depletion is 2 m³/s and zero is reached after 1,850 s. A constant outflow cannot continue into negative storage.
These prescribed rates and ceiling are a fictional continuity example; they do not establish a passive outlet law, geometry or safe release.
Answer: Final 3,700 m³, remaining 1,300 m³, additional 162.5 s to ceiling. Chosen depletion interval lasts 1,850 s to zero; then the boundary conditions must change.
Check your understanding: Does lower peak discharge guarantee lower total volume or lower downstream risk? Why can a model with an outlet depending only on upstream level fail during backwater? What happens if the image’s filling interval starts at 1,500 m³ instead?
Answer: No: detention changes timing; total volume remains conserved unless other routes are represented, and downstream timing/exposure matter. Backwater makes downstream conditions relevant to outflow. With initial 1,500, the unconstrained result is 4,500 m³, exceeding 4,000 by 500; the ceiling is reached after 500 s, requiring an additional route or changed conditions.
Why: Use conservation with initial conditions and capacity, then distinguish the chosen prescribed flow from a physical outlet relationship and whole-system risk.