Wind blades: cycles, material evidence and responsible service
By How things work · myAudience
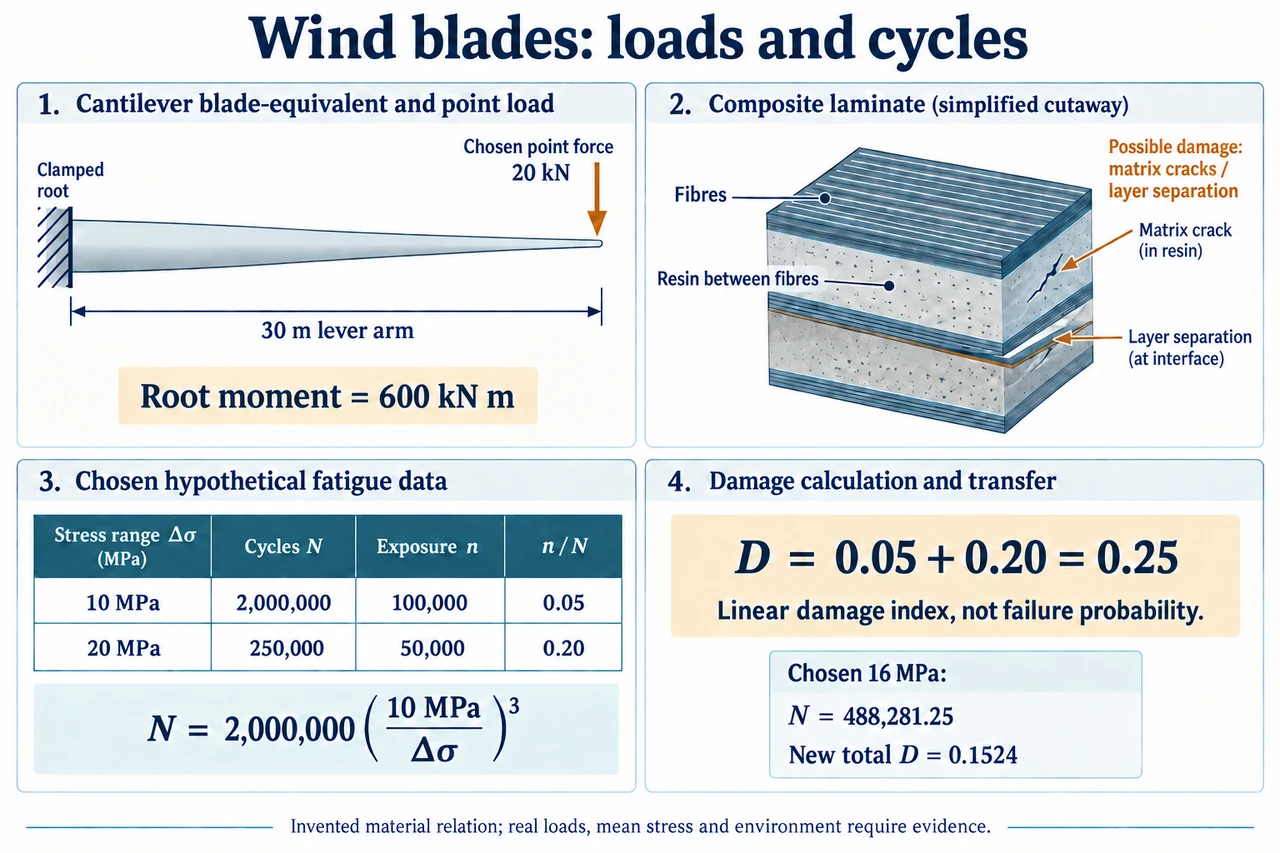
myAudience original rendered teaching illustration. Image: illustration, not a documentary photograph. · Operator-authored generated illustration; scientific acceptance reviewed separately.
Wind blades: cycles, material evidence and responsible service
A wind-turbine blade must resist more than one large force. It experiences changing aerodynamic forces, gravity as it rotates, vibration and different operating events. A component can survive a single load yet develop fatigue damage under many smaller cycles. A blade is also a composite structure: fibres, resin, layers, bonds and local geometry affect strength and damage. 'Stronger material' alone does not establish a lighter, safer or longer-lived blade. This lesson connects a chosen load model to an evidence-based maintenance and lifecycle decision, while retaining the distinction between an educational calculation and a tested structural design.
First distinguish force, moment and stress. In a simple perpendicular point-force example, a 20 kN force at a 30 m lever arm creates a 600 kN m root moment. A distributed aerodynamic load needs integration of local force times lever arm, not blindly placing the total at the blade tip. Stress also depends on section geometry, material directions and connections; dividing that moment by blade length does not give stress. The plate's abstract cantilever is explicitly a chosen equivalent, not a force map of a working rotor. The same total force concentrated farther from the root gives a larger root moment, even if incoming wind power were unchanged. Geometric scaling therefore changes structural questions as well as energy capture.
Materials change the failure mechanisms and what needs measuring. Long reinforcing fibres can carry substantial loads along their direction, while resin transfers loads between fibres and supports the laminate; a bond or a ply transition may create a local weak point. Layer orientation matters, and damage can include matrix cracking, fibre damage and separation between layers. Local buckling, deflection clearance and vibration must also be checked, not treated as synonyms for fatigue. Current laboratory research explores manufacture, joining and end-of-service recovery of different composite systems; it does not establish that every new material is already deployed or universally easier to recycle. The illustrative laminate does not specify a lay-up or a manufacturing recipe.
For a transparent calculation, choose an invented stress-range relation N = 2,000,000(10 MPa/Δσ)³, with N measured in cycles. It represents hypothetical test evidence at fixed mean stress and conditions, not a property of real turbine composite. A range of 10 MPa gives 2,000,000 cycles and 20 MPa gives 250,000 cycles; doubling range reduces the model count by eight. Stress range is peak-to-trough stress, not automatically amplitude; changing that definition would change the input. Actual fatigue relations can depend on mean stress, environment, material orientation and damage history. The plate explicitly marks the table as chosen data so neat numbers do not masquerade as experimental measurements or a replacement interval.
Combine two chosen exposure bins using the linear damage hypothesis D = Σ(n_i/N_i). For 100,000 cycles at 10 MPa and 50,000 cycles at 20 MPa, contributions are 0.05 and 0.20, giving D = 0.25. The larger-range bin supplies 80% of this index despite only one third of counted cycles. A repeated identical block would reach model D = 1 after four blocks. That is a bookkeeping threshold in this assumed model, not a 25% chance of failure, a guarantee of safety, or a prediction that a real blade will break exactly on block four. The hypothesis ignores load order and interactions. The published blade-design research uses more detailed stress/mean-load models and explicitly describes modelling limitations; we borrow the transparent accounting idea, not its design factors or certification authority.
Monitoring and simulation need a declared scope. Converting a changing signal into cycle bins is different from adding every sampled reading as a new cycle. Rainflow counting is one established method used in blade-load research; translating moments into local stresses then requires a structural model. A published small-turbine load-spectrum study excluded starts, stops, extreme gusts and parked cases from its particular simulated spectrum and did not itself establish material fatigue life. Those omissions matter when comparing it with a lifetime claim. A new sensor alarm is evidence to investigate, not proof of a specific crack or permission to keep operating. Compare independent observations, validated detection limits and the consequences of both missed damage and false alarms.
Suppose a fictional controller reduces the high-range exposure from 20 MPa to 16 MPa without changing either cycle count or the low-range bin. The chosen relation gives N = 488,281.25 cycles at 16 MPa; high-bin contribution becomes 0.1024 and total D becomes 0.1524. The index falls by 39.04% relative to 0.25, not by the 20% change in stress range. This is an intentionally nonlinear transfer exercise; it requires measured stress reduction rather than assuming that an energy-output change proves it. If lifetime delivered energy fell from a chosen 1,000 MWh to 950 MWh while an unchanged embodied input were 100 MWh-equivalent, the narrow input/output ratio worsens from 0.1000 to about 0.105263. A genuine avoided replacement could change that lifecycle comparison, but must be included with evidence on both alternatives.
End-of-service planning and local accountability belong in the engineering decision. Keeping a functioning component, specialist repair, repowering and retirement have different material, service and community consequences. Recoverable mass is not the same as recovering each material into equivalent high-value use; composite recovery methods and local processing access differ. Include collection, transport, processing, replacement and land restoration consistently when comparing options. Maintenance workers, neighbours, landholders and electricity users may carry different risks and benefits. An attractive lower damage index does not settle those choices: ask whose service is protected, who pays if the assumed benefit fails, which ecological constraints remain, and what evidence would reverse the preferred plan. Image: illustration, not a documentary photograph.
Worked example: In the invented N = 2,000,000(10 MPa/Δσ)³ relation, replace 50,000 high-range cycles at 20 MPa with 50,000 at 16 MPa. Keep 100,000 cycles at 10 MPa. Calculate the new linear damage index and explain its limits.
At 16 MPa: N = 2,000,000 × (10/16)³ = 488,281.25 cycles.
Low contribution remains 100,000/2,000,000 = 0.05; high contribution is 50,000/488,281.25 = 0.1024.
New D = 0.1524; relative reduction = (0.25 − 0.1524)/0.25 = 0.3904 = 39.04%.
The index uses invented material data and a linear accumulation hypothesis; it ignores order, environment and several other failure modes. It is not a probability or certified lifetime.
Answer: D = 0.1524, a 39.04% model-index reduction, conditional on the specified stress-range change and unchanged cycle counts.
Check your understanding: An engineer interprets D = 0.25 as a 25% failure probability and recommends replacing every real blade after four repeated exposure blocks. Identify two errors and specify missing evidence.
Answer: D is a linear damage index, not a calibrated failure probability. Four blocks reach D = 1 only in the chosen identical-block model, not a universal real replacement rule. Real material/mean-stress/environmental data, complete event/load history, geometry, failure-mode checks and validated inspection/service evidence are needed.
Why: A dimensionless model output does not inherit a probabilistic meaning. Extrapolation requires both the same model assumptions and evidence that those assumptions apply.