Hydropower: river allocation, damage evidence and lifecycle service
By How things work · myAudience
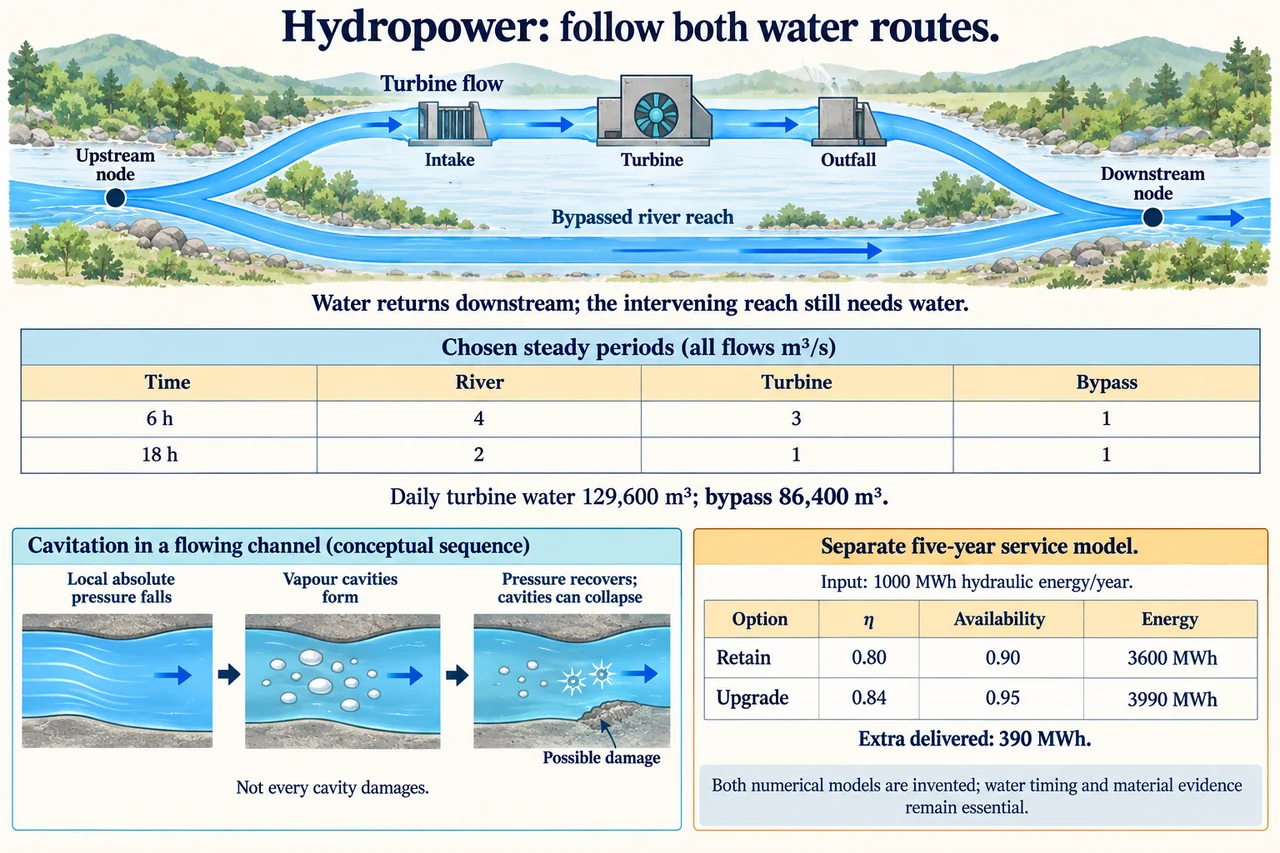
myAudience original rendered teaching illustration. Image: illustration, not a documentary photograph. · Operator-authored generated illustration; scientific acceptance reviewed separately.
Hydropower: river allocation, damage evidence and lifecycle service
A hydropower component's condition and a river's condition are linked, but they are not the same problem. A turbine may convert hydraulic input efficiently while releases harm a bypassed reach or downstream habitat. Conversely, a protective flow rule can change the time and amount of available generation without implying that the turbine has become less efficient. Begin by identifying the water routes, the electrical service and the affected river reaches. A diversion layout is especially revealing: turbine water rejoins downstream, but water between the intake and outlet needs its own explicit allocation. The upper plate is a route model, not a universal environmental permit or a calibrated river cross-section.
Choose two fictional steady periods with constant gross head 30 m, the same hL = 0.50Q² conduit model and net-input-to-electric efficiency 0.80. For six hours natural river flow is 4 m³/s; reserve 1 m³/s in the bypassed reach and allow 3 m³/s through the turbine. For eighteen hours natural flow is 2 m³/s; the same chosen bypass reservation leaves 1 m³/s for the turbine. In each period, river flow equals turbine plus bypass flow. Both routes join downstream, giving the original 4 or 2 m³/s again, assuming no storage change, evaporation or other diversion in this exercise. The 1 m³/s reservation is chosen solely to expose the accounting, not an ecologically validated flow for any species or river.
Account for power and volume over the correct time. At turbine Q = 3, Hn = 25.5 m and electric power is 600.372 kW; six hours gives 3,602.232 kWh. At Q = 1, Hn = 29.5 m and power is 231.516 kW; eighteen hours gives 4,167.288 kWh. Daily model energy is 7,769.52 kWh. Each turbine period passes 64,800 m³, giving 129,600 m³ total turbine water; bypass water is 86,400 m³ across the full day, so total river volume is 216,000 m³. Use 3,600 seconds per hour for volume, while kW × hours gives kWh directly. A flow number is not a volume, and the day's water must not be subtracted from a reservoir without adding its actual inflow and other releases.
Equal daily volumes do not make two release patterns environmentally equivalent. Rapid rises or falls can change shallow-water habitat, strand organisms, alter temperature exposure or interact with life stages; minimum flow alone does not describe the entire response. Sediment movement and water quality also depend on site conditions and timing. A 2022 multi-laboratory report investigated explicit energy–environment linkages and case-specific operating alternatives, including ramping constraints. Its future scenarios and example benefits are conditional model results, not universal proof of a best release schedule. Species, river geometry and season need evidence. The fixed-period exercise deliberately omits a physical transition model and therefore does not predict effects at the boundary between its periods.
Material damage also needs a mechanism rather than a generic label. Abrasive particles can wear surfaces; corrosion involves chemical or electrochemical interactions; cavitation involves vapour cavities forming when local absolute pressure becomes sufficiently low for the liquid conditions and subsequently collapsing as pressure recovers. Collapse near a surface can contribute to damage, but not every detected cavity or vibration means destructive cavitation. Local runner pressures differ from a pool's gross-head reading. The lower plate is a symbolic cavity sequence, not a turbine pressure map or a set of operating thresholds. An alarming sound does not distinguish corrosion, debris, vibration and cavitation by itself, and an educational illustration cannot authorise an inspection or a change to a machine.
Monitoring should improve a justified decision, not manufacture certainty. A Reclamation research project explicitly asked whether damaging and non-damaging cavitation could be distinguished amid background noise and vibration, using laboratory and field evidence. A trend in an accelerometer may support an investigation but needs a validated link to condition and other corroboration. State sampling, uncertainty, event history and which failure modes the method can miss. A quiet signal does not establish an intact machine, while an unreliable alarm can cause unnecessary downtime. Compare competent inspection evidence, maintenance access, outage consequences and remaining service with the consequences of both missed damage and false positives. Do not treat a research detection method as a universally established operating rule.
Use an explicit common boundary for an invented upgrade comparison. Suppose a five-year window has 1,000 MWh of hydraulic energy potentially available each year at the net turbine boundary under the same water allocation. Retention converts with η = 0.80 and chosen availability 0.90, giving 720 MWh/year and 3,600 MWh over five years. A hypothetical upgrade uses η = 0.84 and availability 0.95, giving 798 MWh/year and 3,990 MWh over five years: an additional 390 MWh. Availability is assumed independent of the hydraulic-energy distribution here; real outage timing can change that multiplication. If the upgrade adds a chosen 100 MWh-equivalent of embodied energy, its incremental input is 100/390 ≈ 0.256410 MWh-equivalent per additional delivered MWh. This is a narrow energy comparison, not a carbon-payback prediction or a complete lifecycle assessment.
A responsible judgement asks whether the assumed additional service is useful and whether the additional burdens are acceptable. Replacing a functioning component can add material extraction, transport and waste; repair or a different operating plan may deliver a useful alternative. Retired material collection and usable recovery are different from a nominal recyclable mass percentage. Include unchanged past infrastructure consistently, and compare water quality, habitat, access, worker safety, local knowledge and who pays for disruptions alongside the energy model. A benefit for network users may not compensate people losing access to a river resource. Explain evidence that would reverse the preferred option, and make affected communities part of that judgement. Image: illustration, not a documentary photograph.
Worked example: Under the chosen five-year comparison, an upgrade has η = 0.84. What availability would just match retained output 720 MWh/year when the same net hydraulic input is 1,000 MWh/year? Would that equality settle the upgrade decision?
Model delivered energy is hydraulic energy × efficiency × availability.
Set 1,000 × 0.84 × a = 720, so a = 720/840 = 6/7 ≈ 0.857143.
This equality depends on outage timing being independent of available hydraulic energy and all other boundaries remaining the same.
Equal output alone does not compare added material, retirement, water effects, maintenance access or distribution of benefits.
Answer: About 85.7143% availability matches the retained toy output. It is not a general real outage threshold or a complete lifecycle decision.
Check your understanding: A diversion report says turbine water returns downstream, so zero water need be reserved in the reach between intake and outlet. What is missing, and why does equal daily release volume not resolve it?
Answer: The bypassed reach has its own habitat and water-user needs before the turbine outfall. Return downstream does not supply that upstream intervening reach. Daily totals also omit timing, ramping, temperature, sediment and species/life-stage evidence.
Why: Follow spatial routes and temporal boundaries rather than only a daily mass total. Conservation does not imply equal ecological or social outcomes.