Residual heat: power, accumulated energy and the limits of a safety model
By How things work · myAudience
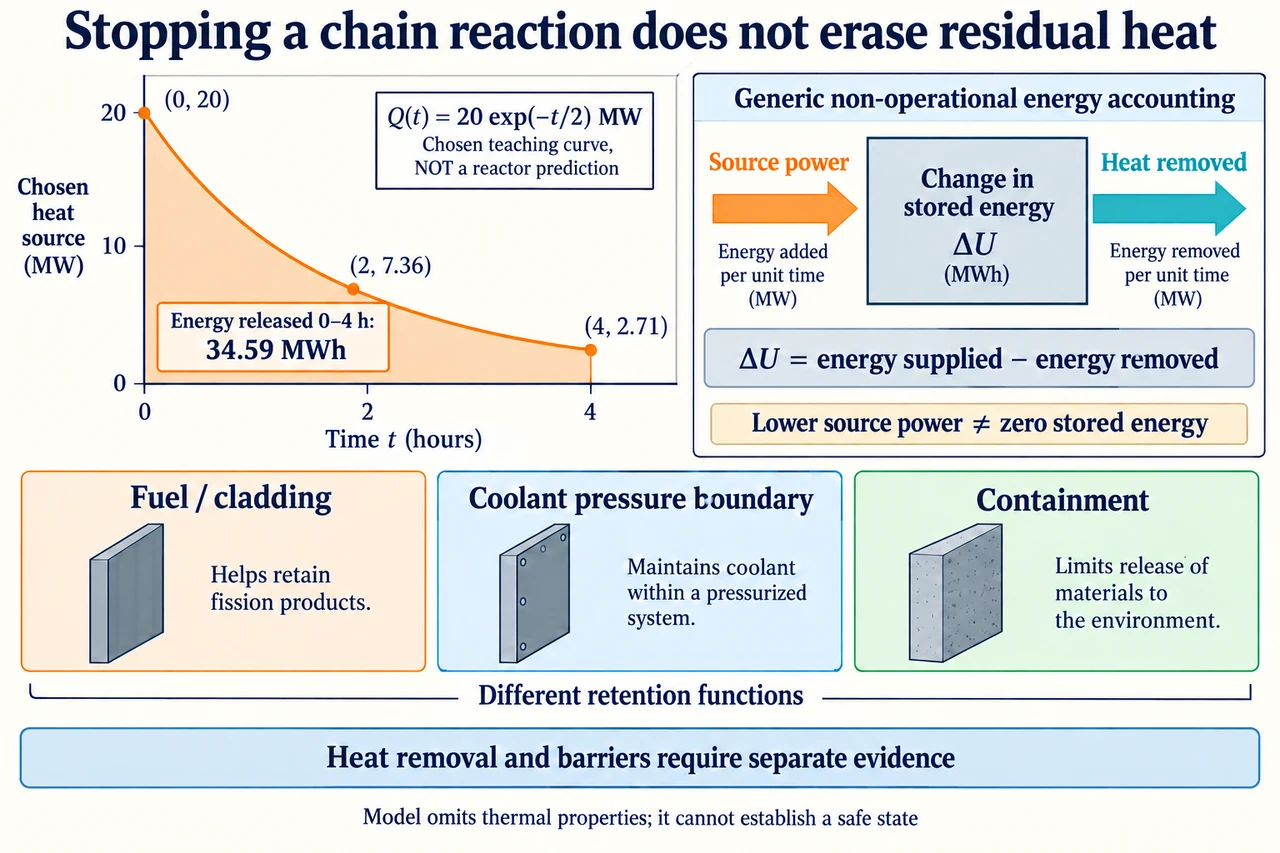
myAudience original rendered teaching illustration. Image: illustration, not a documentary photograph. · Operator-authored generated illustration; independent scientific acceptance pending.
Residual heat: power, accumulated energy and the limits of a safety model
Stopping a fission chain reaction does not instantly remove all sources of heat or all energy already stored in materials. Some fission products remain radioactive and release energy as they decay; interactions of emitted energy and particles with surrounding matter can produce heat. NRC's educational manual distinguishes this decay heat from ongoing fission and explains why heat removal remains a separate requirement. Temperature can also remain elevated because a body already has stored internal energy. These are related but different reasons that 'the reaction stopped' does not mean 'everything is cold'. The plate deliberately separates a source-power curve from a stored-energy accounting box, rather than presenting a reactor control plan or a shutdown timetable.
A single radioactive population with constant decay probability per unit time has dN/dt = −λN and N(t) = N0 exp(−λt). Its half-life is ln2/λ: it describes the population falling by half, not a guarantee that heat, dose and every other hazard halve together. Actual inventories contain multiple products with different decay energies, half-lives and production histories; decay chains and retained versus escaping energy complicate the heat source. Their total cannot generally be represented by one universal exponential. Our curve Q(t) = 20 exp(−t/2) MW, with t measured in hours, is a deliberately invented mathematical source model. It is not derived from a particular reactor, isotopic inventory, prior operating history or a permitted cooling configuration.
Read the plotted numbers as rounded model values: Q(0) = 20 MW, Q(2) = 20/e ≈ 7.3576 MW and Q(4) = 20/e² ≈ 2.7067 MW. The smooth curve and labelled points are a schematic illustration; use the equation, rather than measuring pixels, for numerical work. The exponent must be dimensionless, so the denominator means a chosen two-hour time constant when t is in hours. This is not a two-hour half-life: Q halves at 2 ln2 ≈ 1.3863 h. A declining source is still a source, and a smaller instantaneous power does not establish a small accumulated energy or a low material temperature. The graph supplies none of the missing temperature, geometry or safety evidence.
Energy supplied over an interval is the area under the power curve. Integrating the chosen source from 0 to T hours gives E(T) = 40(1 − exp(−T/2)) MWh. At T = 4, this is 34.58658867… MWh, rounded 34.59 on the plate, or about 124.5117 GJ because 1 MWh = 3.6 GJ. Multiplying the final 2.7067 MW by all four hours gives only10.8268 MWh and underestimates the accumulated input; multiplying the initial20 by four gives 80 MWh and overestimates it. The chosen decreasing curve's exact area lies between those rectangles. Its mathematical total out to infinity is 40 MWh, but that finite integral is a property of this invented equation, not a claim that a real spent-fuel inventory has this total or becomes harmless after four hours.
The accounting box follows ΔU = energy supplied − energy removed, with work and other transfers explicitly omitted for this generic exercise. Choose a separate illustrative heat-removal function C(t) = 10 exp(−t/2) MW over the same 0–4 h interval, rather than a real cooling-system capacity or an operating setting. Removed energy is 20(1 − e⁻²) =17.29329434… MWh, so stored energy increases by the same 17.29329434… MWh while source power declines. If removal instead exactly matched the chosen source throughout, stored-energy change would be zero, but its initial value could still be large. Neither case determines temperature without thermal-property, phase and boundary evidence. The illustration's source and removal arrows are rates; its ΔU is an energy change over the stated interval.
A delayed-removal transfer tests timing. Keep the same fictional source, but let the chosen removal equal zero for 0–1 h and then equal the source for 1–4 h. The first-hour stored-energy increase is 40(1 − exp(−1/2)) =15.73877361… MWh; later net source-minus-removal is zero, so that increase remains at hour4. Total energy removed during1–4 is 18.84781506… MWh, not the entire34.5866 MWh supplied. Matching a source after a delay stops further increase in this model; it does not erase the earlier increment. Real removal rates depend on temperature differences, flow, available sinks and equipment behaviour, so these chosen functions cannot certify a cooling design or an acceptable response time.
NRC describes different retention roles for fuel/cladding, the coolant-system pressure boundary and containment. The plate shows separate function cards, not a nested blueprint or a demonstration that each wall works independently. Fuel material can retain some products and sealed cladding helps contain them, including gases in enclosed spaces; the coolant boundary retains fluid, and containment helps limit environmental release. Heat removal protects conditions needed for barriers to function, but a barrier does not eliminate the heat source. Multiple layers need evidence about interactions, common dependencies, testing and maintenance; counting three labels is not a probability-of-failure calculation. Radioactivity, heat generation and pathways of exposure need distinct assessment, so a decreasing heat curve alone cannot establish radiological safety.
Long-lived responsibilities require more than a short source-power plot. The official waste backgrounder distinguishes waste categories and explains that radioactive products have different persistence and heat contributions; its particular historical inventory and exposure figures are not assumptions in our exercise. Storage, transport, long-term stewardship, funding and the voices of affected communities must be assessed over appropriate boundaries and periods. An option may shift burdens to future custodians while serving today's electricity users. Ask which uncertainties matter to a decision, who can challenge the evidence and which independent regulatory and site-specific reviews are required. This learning model explains why power, stored energy and barrier functions are separate; it supplies no operating thresholds or conclusion that a real state is safe. Image: illustration, not a documentary photograph.
Worked example: For the fictional Q(t)=20 exp(−t/2) MW with t in hours, calculate0–4 h supplied energy, stored-energy change when C(t)=10 exp(−t/2) MW, and the result when removal is zero for 0–1 h then exactly equals Q. Explain why declining Q does not prove cooling or safety.
Integrate Q: E0–4 =40(1 − exp(−2)) =34.58658867… MWh.
Integrate C: removed =20(1 − exp(−2)) =17.29329434… MWh. Thus ΔU =17.29329434… MWh.
For delayed removal, ΔU0–1 =40(1 − exp(−0.5)) =15.73877361… MWh. Net transfer afterward is zero, preserving that increment.
Removed1–4 =34.58658867… −15.73877361… =18.84781506… MWh.
Neither result gives an initial stored energy, a temperature, a dose or a valid real-reactor source/removal history.
Answer: Supplied34.5866 MWh. Half-source removal gives stored-energy increase 17.2933 MWh; delayed matched removal gives 15.7388 MWh. A declining source can coexist with rising stored energy; this fictional model cannot certify a safe state.
Check your understanding: Someone calls the chosen2 h time constant a half-life, estimates four-hour input as Q(4) × 4 and says three barrier cards prove independent safety. Correct all three claims with justified reasoning.
Answer: The chosen source half-time is 2 ln2 ≈1.3863 h, since exp(−t/2) = 1/2. Final-power rectangle gives 10.8268 MWh, whereas integration gives 34.5866 MWh: a decreasing source was greater throughout earlier times. These are properties of the invented equation, not a nuclear-inventory half-life. Three conceptual retention roles neither supply failure probabilities nor prove independence; shared cooling, support systems, hazards and physical interactions require evidence. Heat, stored energy, temperature and radiological exposure remain distinct.
Why: Use the correct mathematical definition and integrate power over time; do not infer safety from a mechanism illustration or substitute a source curve for a complete material and risk model.