Geothermal reservoirs: thermal budgets, service and local evidence
By How things work · myAudience
myAudience original rendered teaching illustration. Image: illustration, not a documentary photograph. · Operator-authored generated illustration; scientific model reviewed separately.
Geothermal reservoirs: thermal budgets, service and local evidence
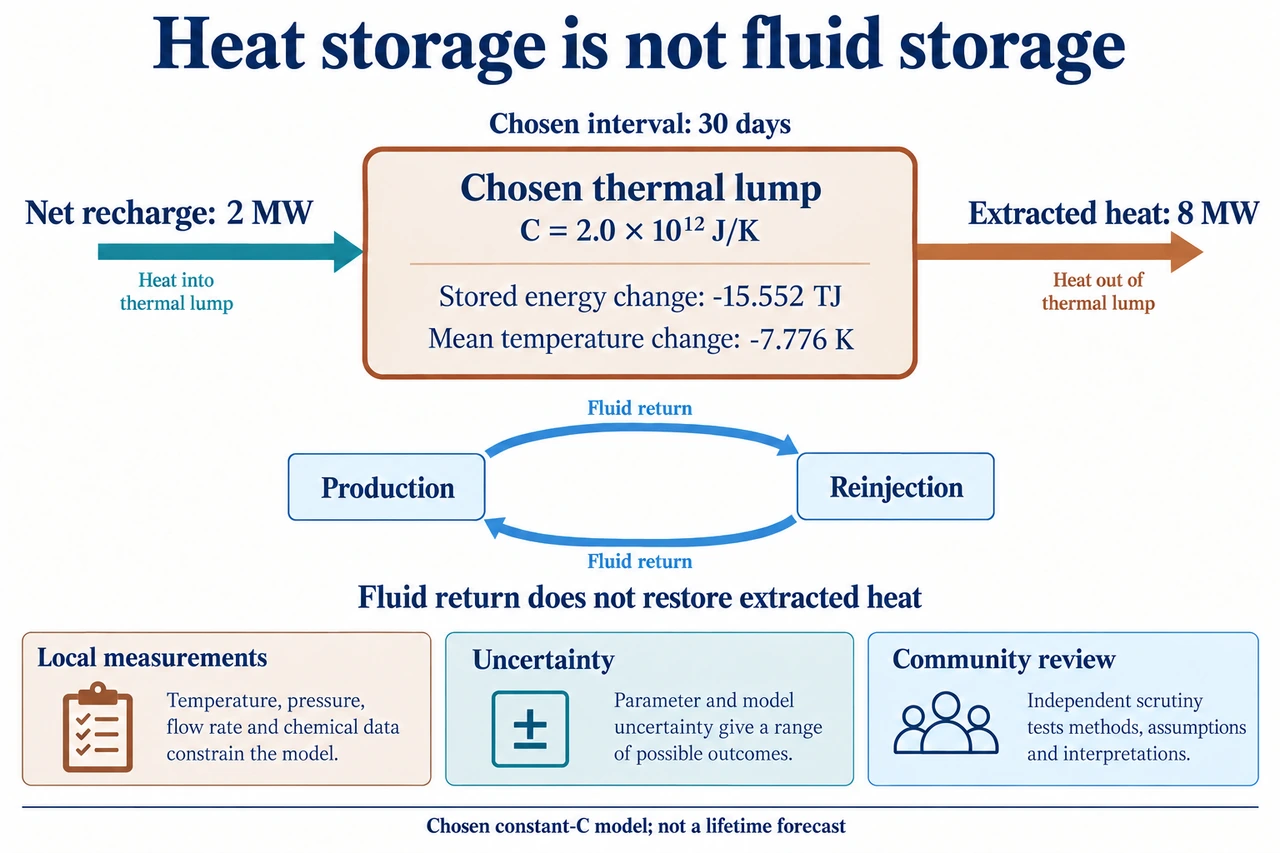
Returning fluid is not the same as restoring the heat that was extracted from it. The lower loop on the plate depicts that qualitative mass-return idea separately from the upper thermal-storage balance. Define one fictional effective rock-and-fluid thermal lump with constant heat capacity C = 2.0 × 10¹² J/K and initial mean temperature 450 K. Choose a constant net thermal recharge of 2 MW and constant extracted heat of 8 MW over exactly 30 days. Net recharge is a stipulated thermal input after any processes already included in that boundary; it is not an extra energy credit for reinjecting each kilogram. The central box is an abstract accounting volume, not the geometry of a real reservoir. It does not specify pore pressure, fracture stability, fluid chemistry or the temperature at a production well.
The first-law storage balance is dU/dt = P_recharge − P_extraction. With the deliberately constant effective C, approximate dU = C dT, giving dT/dt = (P_recharge − P_extraction)/C. The chosen imbalance is −6 MW, meaning stored thermal energy decreases even though both power arrows point in their respective physical directions. Thirty days contains 2,592,000 s, so ΔU = −6 × 10⁶ × 2,592,000 = −1.5552 × 10¹³ J, or −15.552 TJ. Divide by C to obtain ΔT = −7.776 K and the selected mean ends at 442.224 K. The box labels therefore distinguish power in MW, stored-energy change in TJ and temperature change in K. No electrical efficiency belongs in this heat-storage equation unless the complete thermal extraction account is first redefined.
A reservoir is spatially structured, while this lump has only one mean temperature. Flow can sample different rocks and pathways; production and reinjection can change which regions contribute heat, and recharge is not generally constant. Equal mass return does not prove equal energy return because the returning fluid's enthalpy can differ from that of produced fluid. Nor does the model mean temperature directly predict production-fluid temperature: effective coupling, residence times and local thermal fronts matter. Consequently, dividing the initial temperature by the calculated cooling rate is not a plant-life forecast. It would also ignore a service-dependent temperature criterion and extrapolate fixed parameters far beyond the chosen interval. The equation is useful for testing conservation and exposing evidence needs, not for assigning a safe withdrawal schedule or a guaranteed resource lifetime.
Compare a second explicitly chosen service scenario over the same 720-hour interval. Assume the plant extracts 8 MW heat while on and zero heat while off, with an on fraction of 0.75. Recharge continues at 2 MW throughout. Choose constant gross electricity of 0.800 MW and auxiliaries of 0.150 MW while on, plus 0.020 MW imported for auxiliaries while off. This is a separate conditional accounting model; gross and auxiliary values are not predicted from the declining lump temperature. Average extraction is 6 MW, so average storage loss is 4 MW and the selected mean cools by 5.184 K. Average net electricity is 0.75(0.800 − 0.150) − 0.25(0.020) = 0.4825 MW, or 347.4 MWh over 720 hours. Omitting off-state imports would overstate net service even if the thermal account were otherwise correct.
Sensitivity bounds should expose uncertainty rather than dress it up as precision. For the continuous 8 MW extraction case, choose C anywhere from 1.6 × 10¹² to 2.4 × 10¹² J/K and recharge anywhere from 1 to 3 MW. The smallest cooling magnitude combines 5 MW net loss with the largest C: 5.4 K in 30 days. The largest combines 7 MW loss with the smallest C: 11.34 K. These are extreme combinations of chosen parameter ranges, not measured confidence limits or probabilities. They depend on allowing all combinations, so correlated physical parameters could change the attainable bounds. The temperature changes have more digits than a real site estimate would justify because this is exact arithmetic on declared inputs. The check asks the learner to distinguish this sensitivity exercise from evidence about a specific reservoir.
Water and community accounts need their own boundaries. DOE distinguishes water withdrawal from water consumption and notes dependence on plant and cooling configuration. Neither follows automatically from the 20 kg/s thermal source flow used in the preceding lesson. Cooling makeup, geothermal-fluid production, reinjection and municipal access are different quantities and must not be merged into a single unexplained flow. Likewise, operational emissions and a complete lifecycle inventory are different accounts. Ask for the relevant water-source constraints, cooling method, baseline environmental data, service reliability, affected community participation and how results will be disclosed. No water-use factor, emissions factor, price or operating threshold is supplied by this fictional thermal lump, so it cannot establish a quantitative lifecycle benefit or justify excluding people who bear local burdens.
A current paper can analyze older observations. Holmgren, Kaven and Oye's Coso study was published in February 2026 but examines 1996–2010 seismic and operational records. It reports spatially dependent associations between reinjection volume/temperature variation and short-term seismic response. The authors discuss pressure and thermal mechanisms and acknowledge difficulty separating their contributions and uncertainty about comparable behavior elsewhere in the field. That is meaningful local evidence, not a universal causal rule or a safety threshold transferred to every geothermal project. The plate deliberately supplies no seismic hazard colors or invented monitoring plot. A defensible evaluation asks what was measured, where, over which period, with which detection limits and competing explanations, rather than treating a recent publication date as evidence of newly measured conditions everywhere.
Consider a community asked to accept a proposed service expansion. A balanced answer can recognize reliable energy as a benefit while requiring site-specific technical assessment, transparent baseline and ongoing evidence, independent review and genuine participation by affected people. Thermal storage, service availability and local environmental risk remain related but distinct questions; a favorable net-electricity result does not erase uncertainty in seismic or water evidence. A conditional recommendation should name what would change it, such as revised recharge estimates, observed service reliability or contradictory local monitoring, without inventing technical intervention thresholds. The worked model and transfer answer provide a conservation test and an evidence test, not plant certification. The original geothermal mechanism remains intact, and the broader family still needs further independently assessed depth. Image: illustration, not a documentary photograph.
Worked example: Use the declared constant-C lump to calculate 30-day stored-energy and mean-temperature changes at continuous 8 MW extraction and 2 MW recharge. Then evaluate the separately chosen 75%-on service scenario and the explicit C/recharge sensitivity extremes.
30 × 24 × 3600 = 2,592,000 s = 720 h. Continuous net thermal storage power = 2 − 8 = −6 MW.
ΔU = −6 × 10⁶ × 2,592,000 = −15.552 TJ; ΔT = ΔU/(2.0 × 10¹²) = −7.776 K; mean endpoint = 442.224 K.
At 75% on, average extraction = 0.75 × 8 = 6 MW. Continuous recharge remains 2 MW, so ΔT = −4 × 10⁶ × 2,592,000/(2.0 × 10¹²) = −5.184 K.
Average electrical export = 0.75 × (0.800 − 0.150) − 0.25 × 0.020 = 0.4825 MW. Interval net service = 0.4825 × 720 = 347.4 MWh.
For continuous 8 MW extraction, minimum cooling = (8 − 3) × 10⁶ × 2,592,000/(2.4 × 10¹²) = 5.4 K; maximum = (8 − 1) × 10⁶ × 2,592,000/(1.6 × 10¹²) = 11.34 K.
Answer: The continuous chosen thermal lump loses 15.552 TJ and cools by 7.776 K in 30 days. The separate 75%-on model cools by 5.184 K and exports 347.4 MWh after off-state imports. Chosen parameter extremes give 5.4–11.34 K cooling; these are model sensitivity bounds, not a lifetime, well-temperature prediction or measured confidence interval.
Check your understanding: A report reinjects the same fluid mass it produces, therefore sets recharge equal to extraction and promises unlimited service. It treats the 5.4–11.34 K range as a 95% confidence interval and uses the 2026 Coso publication as a universal injection safety rule. Correct each claim and identify evidence needed for a conditional service decision.
Answer: Equal fluid mass return does not ensure restored thermal energy: returning enthalpy and exchange with rock must be accounted for. Recharge cannot be set equal to extraction merely to make storage constant, and a fixed-parameter 30-day thermal lump cannot establish unlimited service. The chosen C/recharge ranges have no sampling distribution, measurement model or stated confidence procedure, so their extreme combinations are sensitivity bounds, not a 95% interval. Coso concerns spatially specific 1996–2010 observations, published in 2026, with pressure/thermal contributions and transferability uncertainties; it supplies no universal safety rule here. A conditional decision needs site-specific thermal/flow and composition evidence, appropriately interpreted local monitoring and uncertainties, cooling-water accounts, actual auxiliary/service records, independent assessment and affected-community participation. A justified answer states the assumptions and what evidence could reverse its recommendation instead of manufacturing an operating threshold.
Why: Separate conservation of mass from thermal storage, conditional service arithmetic from prediction, chosen ranges from statistical inference, and local observational research from universal causal or safety claims.