Biogas benefit: compare the alternative and count residual methane
By How things work · myAudience
myAudience original rendered educational illustration. Image: illustration, not a documentary photograph. · Original myAudience illustration; retained generated asset provenance.
Biogas benefit: compare the alternative and count residual methane
Capturing methane is a physical mechanism; claiming an avoided climate impact requires a comparison. Define the same fictional waste-management service with a chosen potential methane stream M = 32 kg/day in both alternatives. The baseline captures half of that methane and destroys 98% of the captured amount, with no useful recovered electricity. The intervention captures 95%, destroys 99% of its captured methane in a chosen generator model and supplies electricity after auxiliaries. All fractions are invented, not measurements or standards. The potential stream is deliberately held equal to isolate routing effects; real treatment alternatives may generate different methane quantities and need a broader account. The baseline is a stated controlled-destruction alternative, not a claim that untreated waste inevitably emits all 32 kg. Baseline recovered energy is specified as zero, rather than forgotten.
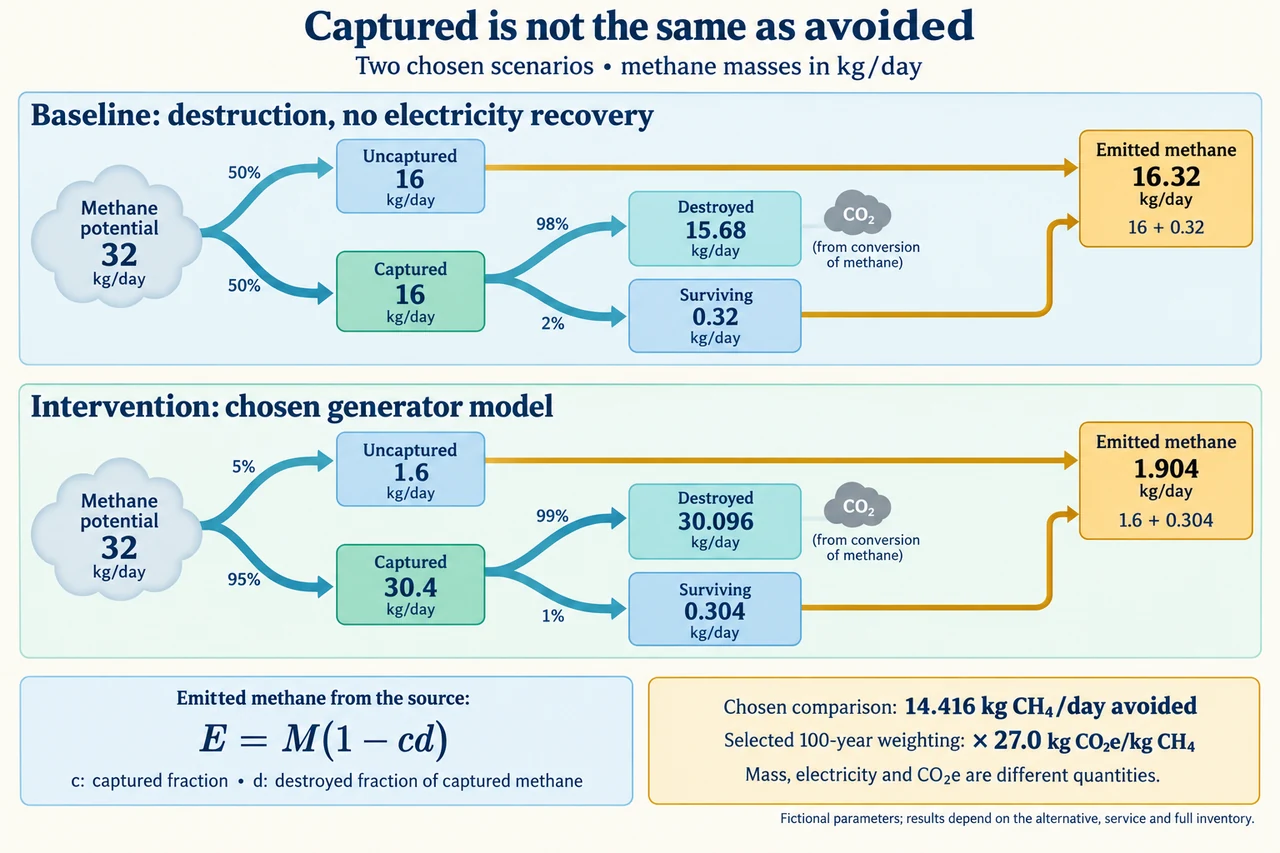
Let c be the fraction captured and d the fraction of captured methane destroyed. Uncaptured emissions are M(1 − c); captured methane that survives destruction is Mc(1 − d). Adding disjoint streams gives E = M[(1 − c) + c(1 − d)] = M(1 − cd). The denominator for d is captured methane, so d is not a second fraction of the original potential stream. In this narrow model, destruction means complete oxidation of the methane so treated, not disappearance of its carbon. Actual equipment can have other incomplete-combustion products and operating variations outside the model. The two emitted branches must remain separate from the destroyed branch. Multiplying only M by an uncaptured fraction understates emissions whenever some captured methane also survives. Captured mass, destroyed mass and avoided emissions are three different answers to three different questions.
The baseline captures 16 kg/day, destroys 15.68 and leaves 0.32 of its captured methane unchanged. Together with 16 uncaptured, baseline methane emissions are 16.32 kg/day. The intervention captures 30.4, destroys 30.096 and leaves 0.304; adding 1.6 uncaptured gives 1.904 kg/day emitted. The difference is 16.32 − 1.904 = 14.416 kg methane/day avoided within this chosen stream account. It is neither all 32 kg of potential methane nor all 30.4 kg captured by the intervention. Each row balances independently: 32 = destroyed + emitted. A good error check therefore catches the appealing but incorrect statement that 95% capture establishes a 95% emissions reduction relative to every alternative. Relative improvement depends on both stages and on what the baseline was already doing.
Keep physical service separate. Stipulate a lower-heating-value coefficient of 13.9 kWh/kg methane for this example and a gross electrical fraction of 0.35 applied to the completely destroyed methane, not to leaking or surviving methane. These are chosen educational parameters, not verified engine or thermochemical ratings. Gross electricity is 30.096 × 13.9 × 0.35 = 146.41704 kWh/day. Subtract the chosen 30 kWh/day auxiliary requirement to obtain 116.41704 kWh/day of net service. The efficiency denominator is stated to avoid assigning electricity to unburned methane or deducting the same loss twice. No external useful-heat credit is given: warmth produced or used internally does not automatically displace another heating service. Complete oxidation physically produces 30.096 × 44/16 = 82.764 kg CO2/day under our nominal masses; that product has not vanished merely because the methane was destroyed.
An emissions metric translates gas masses using a declared convention; it is not chemical heat content. The actual GHG Protocol version2.0 table of August7,2024 lists the AR6-adapted non-fossil methane 100-year weighting as 27.0 kg CO2e per kg CH4. We select that weighting for this illustrative comparison and attribute it to that retrieved accounting publication; the original IPCC table was not successfully retrieved in this research slice. EPA distinguishes scientific communications from reporting programmes that may use other assessment-report conventions. Do not mix horizons or choose a factor to flatter a result. The methane carbon here is assumed short-cycle biogenic for this toy inventory, without an additional net biogenic-combustion CO2 term; that assumption needs evidence about feedstock, land use and carbon stocks before real application. CO2e is not a forecast of a site's temperature change or a regulatory compliance verdict.
Choose a displaced-electricity factor of 0.4 kg CO2e/kWh and a net 60 kg CO2e/day increment from all other included stages, both on the same 100-year convention. They are fictional comparison inputs, not current grid or treatment defaults. The selected net avoided metric is (14.416 × 27) + (116.41704 × 0.4) − 60 = 375.798816 kg CO2e/day. The first term compares residual methane; the second credits the net electricity actually substituting for the specified alternative supply; the third is already an intervention-minus-baseline burden. Do not subtract the baseline again inside that last term or credit gross electricity. This restricted scenario is not a validated whole lifecycle. A real inventory must identify other methane streams, digestate storage, transport, infrastructure, nitrogen emissions and carbon-stock changes explicitly, avoid overlaps, and test uncertain quantities before adopting the result.
Hold the intervention and its service fixed but strengthen the chosen baseline capture to 90%, with destruction 99% and still no useful electricity recovery. Baseline emissions become 32(1 − 0.90 × 0.99) = 3.488 kg/day. The avoided methane is only 1.584, and the selected net metric falls to (1.584 × 27) + 46.566816 − 60 = 29.334816 kg CO2e/day. At 100% baseline capture and 99% destruction, baseline methane emissions are 0.32 kg/day, lower than the intervention's 1.904. The same calculation now gives −56.201184 kg CO2e/day: an added burden within the selected account, not a benefit. A changed alternative can reverse the judgment even though the generator has not changed. These baselines remain chosen scenarios; if a real alternative also recovered electricity, its service would have to be included rather than assumed zero.
Interpret the plate's separate rows as methane mass accounts, not a performance league table. Only uncaptured and surviving methane join each emitted summary; destroyed methane has its own carbon-conversion destination. The weighting card is separate from these physical routes. During generator downtime, controlled destruction could reduce methane while delivering no electricity; an electricity-output fall alone therefore cannot establish the same change in methane emissions. Conversely, a service claim cannot justify assuming losses are absent. A reasoned revision requests time-resolved routing, gas and electricity measurements, counterfactual evidence, maintenance availability and a matched inventory, then considers who gains reliable service and who bears noise, traffic, odour or nutrient risks. Waste prevention and fair participation remain alternatives, not obstacles to an energy narrative. None of the chosen fractions is a safety threshold or operating instruction. Image: illustration, not a documentary photograph.
Worked example: For the stated 32 kg/day stream, calculate residual methane in both scenarios and the conditional net avoided metric. Explain every denominator and credit.
Baseline c = 0.50, d = 0.98: uncaptured 16 kg/day and captured survivor 16 × 0.02 = 0.32 kg/day; emitted methane 16.32 kg/day.
Intervention c = 0.95, d = 0.99: uncaptured 1.6 kg/day and captured survivor 30.4 × 0.01 = 0.304 kg/day; emitted methane 1.904 kg/day. Avoided methane: 14.416; destroyed methane: 30.096 kg/day.
Apply chosen 13.9 kWh/kg and 0.35 to destroyed methane 30.096 kg/day: 146.41704 gross kWh/day; subtract 30 auxiliary kWh/day → 116.41704 net kWh/day. No useful external-heat credit.
Choose consistent GWP100 = 27.0, displacement 0.4 kg CO2e/kWh and other-stage increment 60 kg CO2e/day: 389.232 + 46.566816 − 60 = 375.798816 kg CO2e/day.
Answer: The chosen stream comparison avoids 14.416 kg CH4/day and supplies 116.41704 net kWh/day. The selected restricted inventory difference is 375.798816 kg CO2e/day avoided. It depends on the fictional alternative and full stated assumptions; captured 30.4 kg is not itself avoided emissions, and this is not a certified lifecycle benefit.
Check your understanding: Keep the intervention fixed but replace baseline capture with 90%, then 100%, both at 99% destruction and zero useful electricity. Recalculate and evaluate the statement that the generator must always improve the comparison.
Answer: Baseline 90% gives 3.488 kg CH4/day; avoided methane is 1.584 kg/day. Conditional net avoided metric: 1.584 × 27 + 116.41704 × 0.4 − 60 = 29.334816 kg CO2e/day. Baseline 100% gives 0.32 kg CH4/day; intervention emits 1.584 kg/day more, yielding −1.584 × 27 + 46.566816 − 60 = −56.201184 kg CO2e/day. The sign reverses because the alternative changes, not because the engine changes. These are hypothetical non-energy-recovering baselines; a real baseline supplying electricity requires a service difference too. No conclusion follows without matched potential streams, gas routing, inventory boundaries and uncertainty.
Why: The counterfactual is part of the claim, not an optional appendix. Each alternative starts with the same chosen potential stream but has its own capture and captured-gas survival. Changing baseline capture changes the methane difference even though intervention output stays 116.41704 kWh/day. A negative avoided-emissions result denotes an added burden within the stipulated account, not proof that all generators are harmful. A stronger answer identifies zero baseline energy recovery as an explicit assumption, asks what supply is really displaced, and checks that other-stage increments are neither omitted nor double counted. Gas masses, physical service and selected CO2e weights must remain separate; a chosen accounting sign is not a safety threshold, lifecycle certification or forecast of actual warming.