Selective isolation: why a better outage average can look worse
By How things work · myAudience
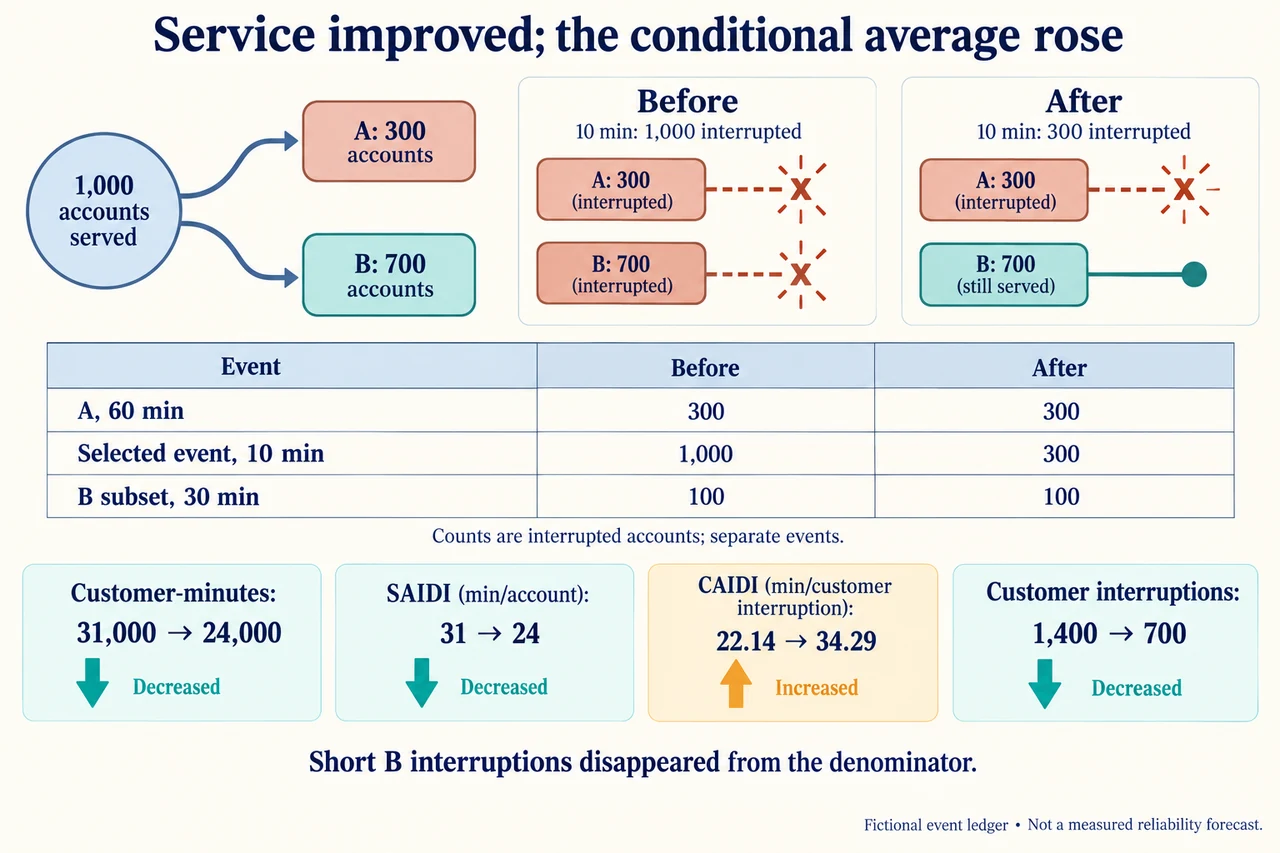
Image: illustration, not a documentary photograph. · Operator-authored generated illustration; scientific model reviewed separately.
Selective isolation: why a better outage average can look worse
Selective isolation aims to remove the affected path without needlessly disconnecting others. That physical aim becomes a service question only after defining whom the network serves, when interruptions occur and what each metric counts. Choose a fictional radial service area with 1,000 customer accounts: branch A has 300 and branch B has 700. We compare three stipulated, non-overlapping sustained events in the same reporting window, not probabilities inferred from a utility’s past. One customer’s interruption can occur more than once. Protecting equipment, supplying electricity and protecting human welfare are related but distinct objectives; neither an average nor an attractive network sketch identifies their full consequences.
Count customer interruptions by summing the accounts interrupted in every event. Count customer-minutes by multiplying each event’s affected accounts by its duration and then summing. SAIFI divides customer interruptions by all 1,000 served accounts; SAIDI divides customer-minutes by the same service population. CAIDI instead divides customer-minutes by customer interruptions, so it describes duration conditional on an interruption, not duration per served account. EIA’s explanations concern sustained, non-momentary interruptions. Our events are chosen to belong to that stipulated category; we invent no universal momentary-duration cutoff. The reporting period and population must stay comparable before interpreting differences.
The before ledger has an A-only event lasting 60 minutes, a whole-system event lasting 10 minutes, and a 100-account subset of B interrupted for 30 minutes. Customer-minutes are 300 × 60 + 1,000 × 10 + 100 × 30 = 31,000. Customer interruptions are 300 + 1,000 + 100 = 1,400. SAIDI is 31 minutes per served account and SAIFI is 1.4 interruptions per served account in this window. CAIDI is 31,000/1,400 = approximately 22.14 minutes per customer interruption. Do not replace 1,400 by distinct people: the repeated A and B accounts legitimately contribute again. Nor should one take an unweighted average of 60, 10 and 30 minutes.
In the after ledger, only the second event changes: selective isolation interrupts A’s 300 accounts for those same 10 minutes while B stays supplied. The totals become 18,000 + 3,000 + 3,000 = 24,000 customer-minutes and 300 + 300 + 100 = 700 customer interruptions. SAIDI falls to 24 and SAIFI to 0.7, but CAIDI rises to 24,000/700 = approximately 34.29 minutes. Nothing here lengthened the first or third event. The short interruptions formerly counted for B disappeared, changing CAIDI’s denominator and the mixture of remaining events. A larger conditional average is therefore compatible with improved total service in this stipulated comparison; reporting only that average would reverse the story.
Account-count weights are not power weights. For the main example, stipulate A demand of 150 kW, B demand of 350 kW, and the interrupted B subset’s demand of 50 kW, constant during each event. Before energy not served is 150 × 1 + 500 × (10/60) + 50 × (30/60) = 258.333 kWh. After it is 150 × 1 + 150 × (10/60) + 50 × (30/60) = 200 kWh. Keeping B supplied during the second event saves 350 × (10/60) = 58.333 kWh. These are ordinary-demand counterfactual quantities, not fault current, fault heating or measured economic loss. Real demand varies and alternatives can supply some services without restoring the whole branch.
The check deliberately changes the power assumptions to expose the limits of customer averages. In that separate scenario A has 300 kW, B has 200 kW, and B’s 100-account subset has 200/7 kW. Retain the three main event durations and introduce a fourth, separate non-overlapping A-only interruption of 10 minutes in the after plan. Its account totals are 27,000 customer-minutes and 1,000 customer interruptions, yielding SAIDI 27, SAIFI 1 and CAIDI 27. Yet before energy is approximately 397.619 kWh and after energy 414.286 kWh: service to fewer account-minutes coincides with more energy not served because demand is differently distributed. Neither account counts nor energy alone establishes harm to residents.
Good comparison also preserves reporting boundaries. EIA’s actual annual table separates methods and whether major events or loss of bulk supply are included; its latest displayed observation when checked is 2024, not a new 2026 measurement. We use those category distinctions, not its national values to validate our fiction. Excluding a major event can answer a routine-performance question while hiding precisely the disruption a community worries about. Comparing two plans requires the same exclusions, account definition, time window and restoration rule, plus uncertainty about what changed. A sequence stipulated in a lesson is not causal evidence that a protection upgrade will reproduce those improvements in a real network.
The plate links one source and branches A and B to a three-event service ledger, then compares duration and conditional-duration metrics with their correct units. It is a functional teaching boundary, not physical wiring, a geographic map or a promise that a particular breaker preserves B. Evaluate maintenance, access to dependable supply, communication during outages, essential services and who bears costs before judging a design. Transparent priorities require evidence and public explanation; one cannot assign a speculative medical vulnerability to people from this account. The lesson’s justified claim is narrow: a service measure is useful only with its denominator, assumptions and affected groups visible. Image: illustration, not a documentary photograph.
Worked example: Reconstruct before/after customer-event metrics and energy not served from all three stipulated events for 1,000 accounts, A = 150 kW, B = 350 kW and the 100-account B subset = 50 kW. Explain why CAIDI rises without longer events and whether these metrics establish community harm.
Before customer-minutes = 300 × 60 + 1,000 × 10 + 100 × 30 = 31,000. Customer interruptions = 300 + 1,000 + 100 = 1,400. All served accounts, including those never interrupted, belong in the 1,000-account denominator for SAIDI and SAIFI.
Before SAIDI = 31,000/1,000 = 31 min/account; SAIFI = 1,400/1,000 = 1.4 interruptions/account; CAIDI = 31,000/1,400 ≈ 22.14 min/customer interruption. The latter is also SAIDI/SAIFI because their denominators cancel, not because event durations can be averaged without weights.
After customer-minutes = 300 × 60 + 300 × 10 + 100 × 30 = 24,000 and customer interruptions = 700. Thus SAIDI = 24, SAIFI = 0.7 and CAIDI ≈ 34.29. B loses 700 fewer short interruptions; the remaining event durations are unchanged.
Before energy not served = 150 × 60/60 + 500 × 10/60 + 50 × 30/60 = 258.333 kWh. After = 150 + 150 × 10/60 + 25 = 200 kWh. The difference is 58.333 kWh, equal to the previously interrupted B load of 350 kW for one sixth of an hour.
The main choice saves 7,000 customer-minutes and 700 customer interruptions. A CAIDI-only comparison would misleadingly call it worse, because it changes the conditional sample by removing short events. All figures describe the stipulated ledger, not causally estimated performance of a real project.
Account-time and energy do not measure social harm, costs or essential-service capability. Use comparable reporting rules and evidence about actual services, alternate supply, maintenance and access before an evaluated decision; no invented customer health or universal monetary valuation.
Answer: Before: SAIDI 31, SAIFI 1.4, CAIDI approximately 22.14 and 258.333 kWh not served. After: 24, 0.7, approximately 34.29 and 200 kWh. Lower total customer interruption exposure coexists with higher conditional mean duration because many short B interruptions vanish; the exercise is not a harm ranking.
Check your understanding: Use a separate altered-demand scenario: A = 300 kW, B = 200 kW, B subset of 100 accounts = 200/7 kW. Keep the original three before events. The after plan isolates A in event two and also has a fourth separate A-only event lasting 10 minutes. Compute after metrics, before/after energy and evaluate whether lower SAIDI proves every service measure improves.
Answer: After customer-minutes = 24,000 + 300 × 10 = 27,000; customer interruptions = 700 + 300 = 1,000. SAIDI = 27 min/account, SAIFI = 1 interruption/account and CAIDI = 27 min/customer interruption. Before energy = 300 + 500/6 + 100/7 ≈ 397.619 kWh. After energy = 300 + 300/6 + 100/7 + 300/6 ≈ 414.286 kWh. Energy not served rises by 50/3 ≈ 16.667 kWh even though SAIDI remains below the main before value of 31. The higher-load A branch’s extra event outweighs preserved B energy. The extra event and changed powers are explicit new assumptions, not a reinterpretation of the original uniform-per-account power model. Neither metric alone establishes harm or equity; inspect affected services and comparable boundaries.
Why: Evaluate weighted counts, repeated events and the distinction between customer-time, ordinary-load energy and societal consequences.