Why a pattern-transfer window can disappear
By How things work · myAudience
myAudience original rendered teaching illustration. Image: illustration, not a documentary photograph. · myAudience educational illustration; no certification or manufacturing qualification is implied.
Why a pattern-transfer window can disappear
A patterned coating is a promise about where material should change, not proof that the change has happened. Development has already opened the mask in this lesson. The target film below those openings is still present. The engineering task is to remove that exposed film while retaining enough mask over protected regions and limiting damage to the layer underneath. These are three simultaneous demands on different materials. A central hole in the mask and a central hole through the target film describe different stages. The illustration deliberately separates them rather than treating a printed pattern as a finished circuit.
Selectivity compares material-removal rates. If the target loses ten units of thickness while the mask loses two, their chosen rate ratio is five. This ratio says nothing by itself about sideways erosion, local feature shape or the absolute amount of mask available. A highly selective process can still fail because the initial mask is too thin, or because the thickest target region requires more removal than expected. Directionality is a separate property: preferential downward removal and equal removal in every direction produce different shapes even if their target-to-mask rate ratios match. Our constant-rate model isolates thickness bookkeeping; it does not represent those geometric effects.
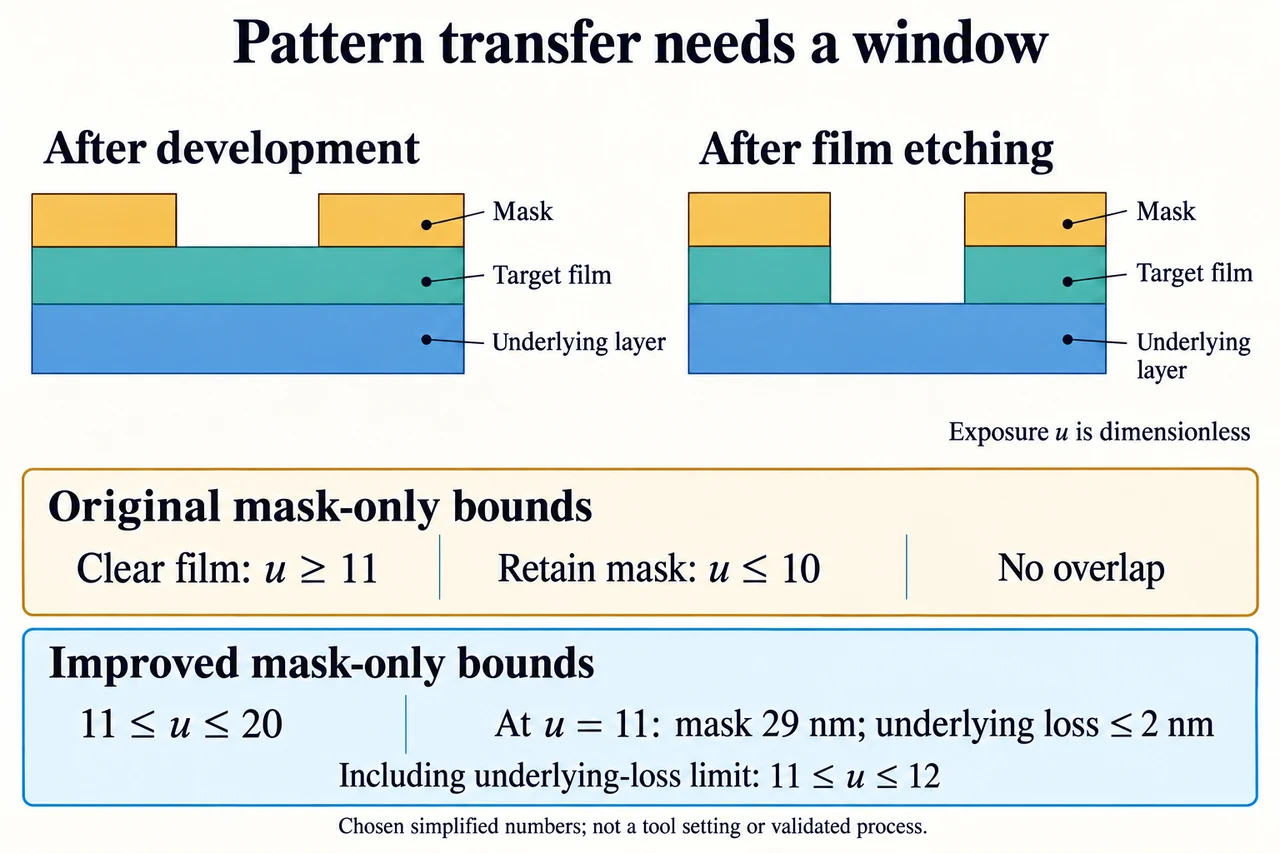
Introduce a dimensionless exposure coordinate u. It is an invented mathematical coordinate, not seconds, machine power or a fabrication setting. Suppose target thickness varies from 90 to 110 nm across the considered sites. Its chosen removal rate is 10 nm per unit u. The mask starts at 40 nm and must retain at least 20 nm. With mask loss of 2 nm per unit u, clearing the thickest target requires u at least 11, but retaining the mask requires u at most 10. Both inequalities must hold at once. Their intervals do not overlap, so no exposure satisfies this particular model. Running longer cannot rescue a protection budget that already fails.
Now change only the chosen mask-loss rate to 1 nm per unit u. The clearing lower bound remains 11, while the mask upper bound becomes 20. This creates a mathematical interval, but that is not yet a reliable process window. A site initially containing 90 nm of target clears at u = 9. Its underlying layer then becomes exposed before the 110 nm site clears. If the underlying layer loses 1 nm per unit u after local clearing, it loses 2 nm by u = 11. A declared maximum underlying loss of 3 nm therefore tightens the interval to 11 through 12, not the mask-only upper bound of 20. Each new constraint can shrink a seemingly generous window.
The illustration shows an amber mask, a teal target and a blue underlying layer. In the first cutaway the teal film continues under the mask opening. In the second it is absent within the opening, while protected teal remains below amber. Layer heights and opening widths are schematic, not measurements. The two lower strips compare the conflicting mask-only bounds with the improved mask-only bounds; the written calculation then adds the underlying-layer constraint. The caption at u = 11 reports the remaining 29 nm of mask and at most 2 nm of underlying loss in the original 90–110 nm thickness interval. The picture is a model argument, not a working chip layout.
A repeated instrument reading is not automatically accurate. Calibration, the definition of the measured edge, instrument response and reference uncertainty can affect the reported thickness or linewidth. NIST’s historical metrology abstract distinguishes accuracy from an emphasis on precision, while its plasma-process work explains why interpreting an endpoint signal requires physical evidence. Our interval calculation uses bounded thickness values without assigning probabilities to them. A narrow spread of repeated readings cannot erase a shared bias. Nor may an engineer silently combine an optimistic film bound, an optimistic removal rate and an optimistic mask loss as though their agreement were demonstrated.
An unfamiliar transfer changes the justified film interval to 85–115 nm. Keeping the improved mask-loss model, the thickest site clears at u = 11.5. The mask retains 28.5 nm. The thinnest site cleared at u = 8.5, so its underlying layer has lost 3 nm. The declared non-strict limits are met exactly at the underlying-loss boundary; there is no margin for unmodelled variation. The result supports neither a robust operating recommendation nor a probability of success. Useful next evidence would test spatial rate variation, feature dependence, endpoint interpretation and the accuracy of the thickness bounds, rather than simply adding another decimal to u.
A defensible design decision asks what the model leaves out and who bears the consequences. Changing materials or adding a thicker protective layer may affect later removal, waste, energy and compatibility with existing layers. A lower nominal loss rate is valuable only if it is supported under the relevant conditions. Worker protection and waste treatment require professional systems, and production settings are deliberately absent here. Compare alternatives using measured constraints, accessible instrumentation and stated resource boundaries; revise the choice when evidence changes. Image: illustration, not a documentary photograph.
Worked example: Use the chosen constant-rate model to test whether the original mask-loss case can clear every 90–110 nm target site, retain at least 20 nm of its initially 40 nm mask, and lose no more than 3 nm of the underlying layer. Then change mask loss from 2 to 1 nm per unit u and find the full feasible interval. Target removal is 10 nm per u; underlying loss is 1 nm per u only after a site clears. u is dimensionless.
Start by choosing a system boundary for each inequality. Target clearance concerns exposed target, not protected target. Mask retention concerns the protected regions, and underlying loss starts only after an exposed site locally clears. No numerical bound here is a tool setting. The 110 nm site controls clearance because 110 / 10 = 11; all sites require u ≥ 11.
In the original case, mask remaining is 40 − 2u. Requiring this to be at least 20 gives 40 − 2u ≥ 20 and therefore u ≤ 10. There is no number that is both at least 11 and at most 10. At the clearing value 11, mask remaining would be 18 nm, which violates the 20 nm requirement. The conflict is physical within the chosen bookkeeping, not a rounding error or permission to average the requirements.
For mask loss of 1 nm per u, retention gives 40 − u ≥ 20, hence u ≤ 20. Do not stop at the apparent mask-only interval 11–20. The initially 90 nm site clears at 9, so underlying loss there is max(0, u − 9) nm. Limiting it to 3 gives u ≤ 12. The full interval is therefore 11 ≤ u ≤ 12. At 11, mask is 29 nm and maximum underlying loss is 2 nm; at 12, mask is 28 nm and underlying loss is 3 nm.
The evaluated decision is conditional: lowering mask loss restores a non-empty interval only within the stated model and limits. It does not establish a real process window because the model omits lateral erosion, changing rates, feature-dependent effects, uncertain calibration and local correlations. A higher selectivity ratio by itself also cannot guarantee success: the underlying-layer constraint is separate. Keep the full inequalities and their assumptions with the result so that a future measured thickness or rate change can be checked without pretending the earlier answer was universal.
Answer: Original case: no feasible u. Improved mask-loss case: 11 ≤ u ≤ 12 after including the underlying layer, rather than the mask-only interval 11–20. These are bounds of the fictional model, not validated tool settings.
Check your understanding: A justified revised thickness interval is 85–115 nm, with all other values from the improved case unchanged. Does a feasible interval remain? Evaluate whether the result is robust, and identify evidence that could change it.
Answer: The thickest site requires u ≥ 11.5. The thinnest site clears at 8.5, so the underlying-loss condition gives u ≤ 11.5. Mask retention permits u ≤ 20. Their intersection is exactly u = 11.5: 28.5 nm mask remains and underlying loss is 3 nm. The non-strict mathematical limits are satisfied, but this zero-width interval provides no tolerance for unmodelled variation. It is not a robust operating claim. Independently justified thickness bounds, calibrated metrology, spatial/feature-dependent rate evidence and validated endpoint behaviour could either rule out or change the apparent boundary solution.
Why: Use the largest film thickness for clearing and the smallest for earliest underlying exposure; checking only average thickness misses the limiting sites.