Electricity that reaches people when they need it
By How things work · myAudience
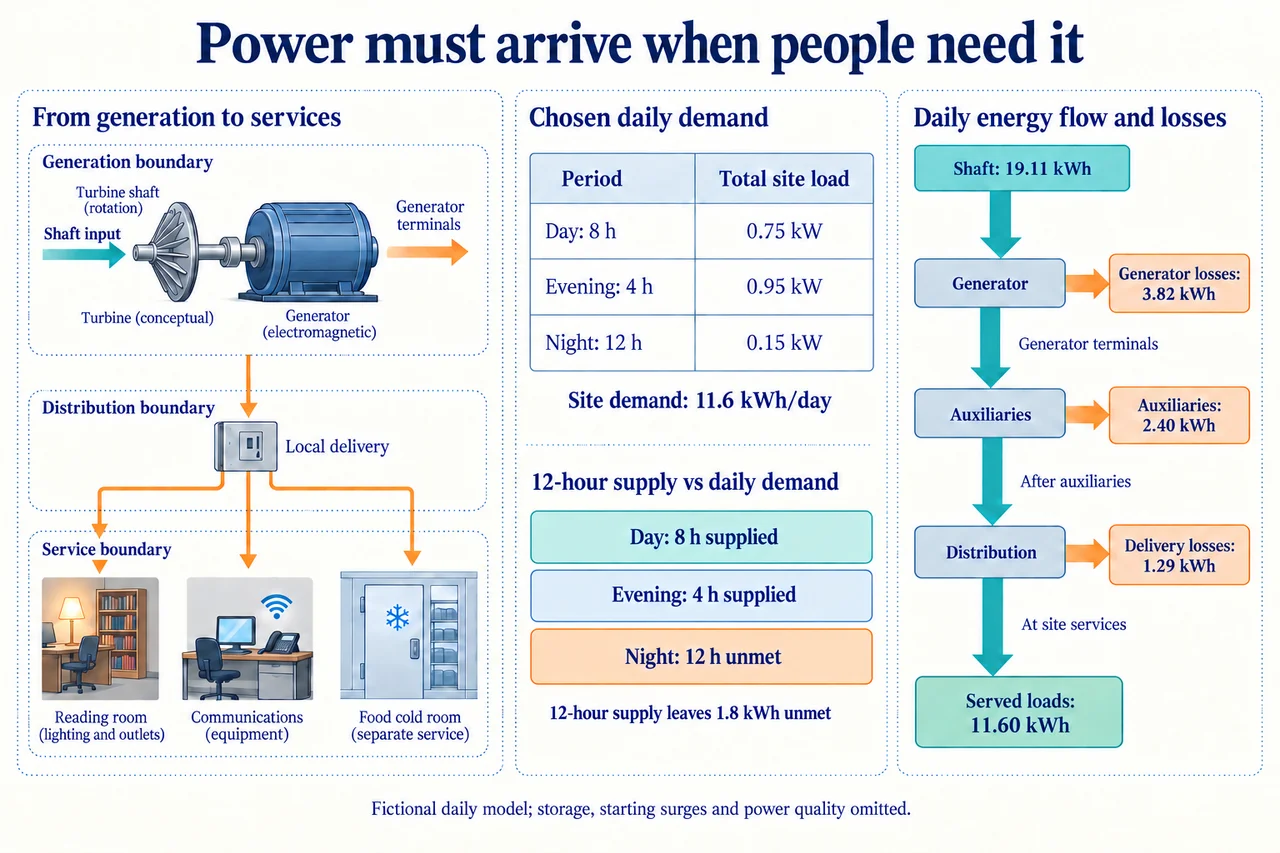
myAudience original rendered teaching illustration. Image: illustration, not a documentary photograph. Left: a conceptual generator-to-service boundary. Centre: the chosen daily demand and separate twelve-hour supply case, which leaves overnight demand unmet. Right: the full-day shaft-to-site energy account, including generator, auxiliary and delivery losses. Values are fictional rounded teaching quantities. · Operator-authored generated illustration; scientific model reviewed separately.
Electricity that reaches people when they need it
Begin with the person using the electricity, rather than the generator's catalogue page. A fictional community learning hub needs an evening reading room, daytime communications and a continuously powered food cold room. The service is usable light, communication and cooling at the required times; the generator is one possible means of supporting it. Ask the users which services must continue, which can move in time, and who might be excluded by the price. WHO's electricity-access work similarly distinguishes basic services such as lighting and communication from the mere presence of a connection. Our invented hub is not a health facility, and its load values do not specify safe refrigeration, educational lighting levels or medical power.
Draw boundaries before comparing machines. The generator receives mechanical work at its shaft and supplies electricity at its terminals. Its prime mover and energy source lie upstream; local distribution, appliances, payment arrangements and the users' actual tasks lie downstream. EIA describes electricity as an energy carrier and explains that different prime movers can drive generators; photovoltaic cells provide electricity through a different mechanism. We will not assume the shaft is powered by a particular fuel or river, or call all terminal electricity environmentally identical. A shaft-to-terminal calculation cannot establish fuel-to-service efficiency, pollution or fairness. An apparently excellent machine can sit inside a service system that excludes its intended users.
Our fictional demand profile has three separate periods covering one whole day. A continuous background load is 0.15 kW for 24 hours. Daytime communications add 0.60 kW for eight hours; evening reading-room equipment adds 0.80 kW for four hours. The remaining twelve hours contain only the background load. Thus total site powers are 0.75 kW by day, 0.95 kW in the evening and 0.15 kW at night. Their energies are 6.00, 3.80 and 1.80 kWh, totalling 11.60 kWh. Power describes a rate; energy accumulates over time. Adding all three powers as though those periods occur together would invent a simultaneous load that this schedule does not contain.
Suppose a proposal supplies only the eight daytime and four evening hours, with no alternate supply or storage. It can serve 9.80 kWh but leaves the 1.80 kWh overnight requirement unmet. Reporting that 84.5% of daily demanded energy was delivered is arithmetically correct and may be a poor service verdict: the continuously required background service has an entire twelve-hour interruption. Additional midday production does not travel forward in time by itself. A larger generator operated on the same schedule therefore cannot resolve the timing mismatch. Before assuming the cold room remains useful, its owners would need actual thermal records and the applicable operating requirements; the simplified electricity account neither predicts food temperature nor establishes acceptable interruption.
Now analyse a different proposal that operates throughout the day. The illustration's right-hand energy account represents this full-day proposal; its centre cards describe the separate twelve-hour proposal. At each operating instant, an invented 0.10 kW auxiliary load is taken at the generator terminals before the remaining electricity enters local distribution. Distribution delivers 90% of that remaining energy to site loads; the generator supplies 80% of its shaft input electrically. These are chosen constant comparison factors, not measured ratings. Covering 11.60 kWh at the site therefore needs 11.60/0.90 plus 0.10 × 24 = 15.2889 kWh at the generator terminals, and 15.2889/0.80 = 19.1111 kWh at the shaft. The worst scheduled terminal power is 0.95/0.90 + 0.10 = 1.15556 kW. Neither the daily energy nor this steady real-power limit checks starting surges, reactive power, voltage, frequency or protection.
Reconcile the losses without counting an intermediate flow twice. The full-day shaft input partitions into 3.82222 kWh generator losses, 2.40 kWh auxiliaries, 1.28889 kWh distribution losses and 11.60 kWh supplied to appliances. Those four terms sum to 19.1111 kWh; the 15.2889 kWh terminal flow is not a fifth output. Site electrical input is also not the same quantity as useful light, cooling or communication: their adequacy requires further appliance and task evidence. Our 12-hour proposal needs only 9.80/0.90 + 1.20 = 12.0889 kWh at the terminals, partly because it supplies less service. Comparing that smaller number against full-day operation and declaring it the better design would reward missing an agreed need.
An explicit energy budget reveals another bottleneck. If the full-day proposal is limited to 14.00 kWh at its terminals, 2.40 kWh still goes to auxiliaries. After distribution, only (14.00 − 2.40) × 0.90 = 10.44 kWh reaches site loads, short of 11.60 kWh by 1.16 kWh. Hypothetically reducing the continuous load to 0.10 kW while preserving the same acceptable task would change the demand to 10.40 kWh and terminal need to 13.9556 kWh. That fits the budget narrowly, but only if actual appliance evidence demonstrates equivalent service. The example does not recommend turning off essential equipment or replacing it on an unverified efficiency claim. Reduced energy input and reduced service are different explanations for a smaller meter reading.
Finally, define success beyond the meter. World Bank/ESMAP's foundational multi-tier work treats energy access through attributes including capacity, duration, reliability, quality, affordability and safety; we use that distinction without assigning this hub a formal tier or copying a household threshold. The proposed schedule and quantities establish only a bounded energy comparison. Users still need affordable participation, trained support, suitable equipment, timely energy supply and an agreed response when service fails. Nearby residents and workers may bear noise, pollution or other burdens depending on the actual prime mover. Ask for evidence of those consequences and include affected people in the decision. Weigh benefits and burdens explicitly rather than infer that a generator's presence, an efficiency percentage or an attractive illustration proves adequate access.
Worked example: Use the invented three-period load profile, constant generator efficiency 0.80, delivery efficiency 0.90 and terminal auxiliaries 0.10 kW. Compare twelve-hour and full-day proposals, close the full-day energy account and assess a 14.00 kWh terminal budget. No storage or alternate supply.
Separate base demand from additional services before combining time periods. Base energy is 0.15 × 24 = 3.60 kWh; communications require 0.60 × 8 = 4.80 kWh; reading-room equipment requires 0.80 × 4 = 3.20 kWh. Total 11.60 kWh equals the separate period calculation 0.75 × 8 + 0.95 × 4 + 0.15 × 12.
The twelve-hour schedule covers only day and evening: 6.00 + 3.80 = 9.80 kWh, leaving 1.80 kWh at night. Its served-energy share is 9.80/11.60 ≈ 84.48%, not a guarantee of acceptable continuous service. Terminal input is 9.80/0.90 + 0.10 × 12 ≈ 12.0889 kWh; compare like service before calling this an improvement.
Full-day terminal input is 11.60/0.90 + 2.40 ≈ 15.2889 kWh. The division supplies distribution losses; the auxiliary term sits upstream of distribution and is added separately. Dividing the combined site-plus-auxiliary energy by 0.90 would apply a downstream loss to the wrong branch.
Shaft input is 15.2889/0.80 ≈ 19.1111 kWh. Generator losses are 19.1111 − 15.2889 ≈ 3.82222 kWh; distribution losses are 11.60/0.90 − 11.60 ≈ 1.28889 kWh. Sum only final branches: 3.82222 + 2.40 + 1.28889 + 11.60 ≈ 19.1111 kWh, with rounding in the displayed values.
Check peak rate separately: evening terminals must supply 0.95/0.90 + 0.10 ≈ 1.15556 kW; shaft rate is about 1.44444 kW under the same factors. A source can have enough daily energy but insufficient instantaneous power. These steady calculations leave AC apparent-power, surge and quality evidence unresolved.
At a 14.00 kWh terminal budget, site energy is at most (14.00 − 2.40) × 0.90 = 10.44 kWh. The full schedule therefore fails by 1.16 kWh. A hypothetical equally effective 0.10 kW background appliance lowers daily demand to 10.40 kWh and terminal need to 13.9556 kWh, leaving only 0.04444 kWh terminal margin; no real service equivalence or robustness is established.
Answer: Twelve-hour operation leaves 1.80 kWh overnight unmet. Full-day service requires 15.2889 kWh terminals and 19.1111 kWh shaft, with scheduled peak 1.15556 kW terminals. The 14.00 kWh budget fails the original demand; only a separately evidenced service-equivalent demand reduction makes the revised toy account fit.
Check your understanding: A different fictional hub has continuous 0.20 kW demand, an additional 0.50 kW for six daytime hours and additional 0.70 kW for three evening hours. Its delivery factor is 0.92, terminal auxiliaries 0.08 kW whenever running and generator efficiency 0.85. A salesperson proposes nine-hour operation and quotes a 13.00 kWh terminal budget. Does the schedule serve the stated need, and could full-day operation fit that budget? Check both timing and peak terminal power.
Answer: Daily demand is 0.20 × 24 + 0.50 × 6 + 0.70 × 3 = 9.90 kWh. Nine-hour operation serves (0.20 + 0.50) × 6 + (0.20 + 0.70) × 3 = 6.90 kWh and leaves 0.20 × 15 = 3.00 kWh unmet; extra capacity cannot cover those hours without another supply path. Full-day terminal requirement is 9.90/0.92 + 0.08 × 24 ≈ 12.6809 kWh, below 13.00 by about 0.31913 kWh. Shaft requirement is about 14.9187 kWh. Evening peak terminals need 0.90/0.92 + 0.08 ≈ 1.05826 kW. Under the invented factors the energy budget can fit full-day service, but nine-hour operation still fails it; instantaneous capability, quality, service suitability and safe engineering remain unverified.
Why: Separate the full-day service requirement from the proposed operating hours, then keep auxiliary and distribution branches on the correct side of the boundary. A quantity budget and a peak power check address different constraints; neither proves task suitability, affordable access, AC quality or safe operation.