Desalination: pressure energy gets a second job
By How things work · myAudience
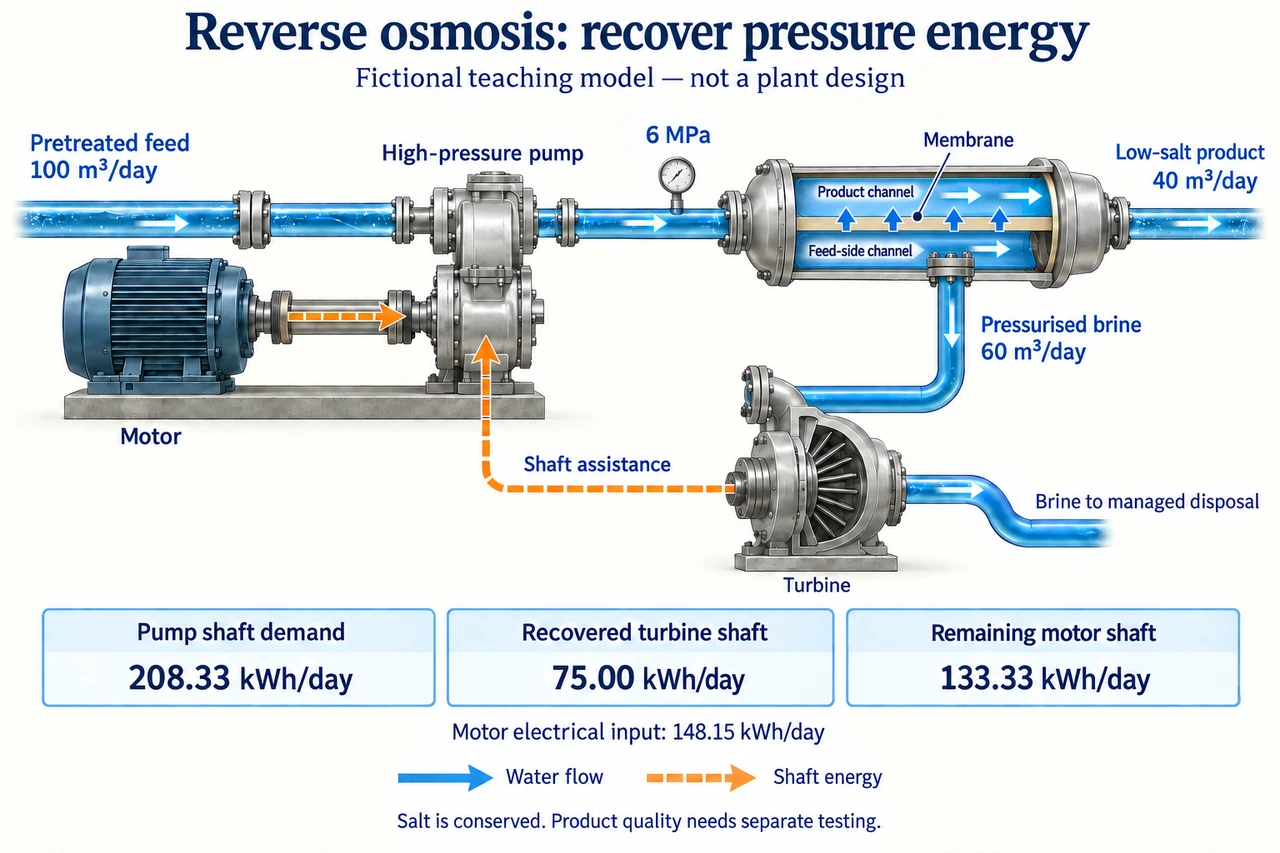
Image: illustration, not a documentary photograph. In this fictional reverse-osmosis arrangement, blue arrows show water flow and orange connections show shaft assistance. Product and brine leave different membrane channels; pressurised brine drives a turbine before managed disposal. Daily energies are independently rounded from the exact model. · Operator-authored generated teaching illustration; scientific concept/model review retained separately.
Desalination: pressure energy gets a second job
Imagine a coastal community comparing two ways to deliver the same daily volume of low-salt water. Begin with the service: how much product must reach users, what quality it needs, and how reliably the system can supply it. A reverse-osmosis membrane is one part of that service. Pretreatment, pumps, energy recovery, product conditioning, storage and distribution belong to different stages, and the concentrated remainder needs a managed destination. We will examine a deliberately smaller boundary: pretreated feed entering a pressure-driven separation train, product and brine leaving it, and the energy supplied to its pump. Everything in the numerical example is invented teaching data. A calculation inside this boundary can explain a design tradeoff, while a community decision needs evidence about the wider service.
Recovery describes how much feed becomes product: R = Vp/Vf for volumes measured over the same interval. In our steady-flow approximation, Vf = Vp + Vb. Salt rejection answers another question: how small product concentration cp is relative to feed concentration cf, expressed here as 1 − cp/cf. Those two fractions can be very different. A train receiving 100 m³ in one day and recovering 40% supplies 40 m³ of product and leaves 60 m³ of brine. At declared concentrations of 35 kg/m³ in the feed and 0.35 kg/m³ in the product, 3,500 kg of dissolved salt enters and 14 kg leaves with the product. The remaining 3,486 kg leaves in the brine. We use an additive-volume, constant-density approximation to keep the bookkeeping accessible; real saline streams require their measured properties.
The pump must provide a pressure difference that drives net water transport against the membrane's osmotic opposition. As water passes out of the feed-side stream, the remaining solution becomes more concentrated. Concentration near a membrane can also differ from the bulk concentration used in our account. Deposits, temperature, membrane condition and flow losses influence an actual train's operation. A salt balance tells us how much salt goes where; it does not tell us the required operating pressure or prove that a specified flow is achievable. Ideal dilute-solution osmotic reasoning helps explain the direction of the effect, but seawater contains several interacting dissolved species and need not follow a simple dilute estimate. Our 6 MPa pressure is supplied as a model assumption. The changed case will supply a different pressure assumption explicitly.
Brine can leave the membrane train while still pressurised. If that pressure is simply dissipated, an opportunity to reuse part of its mechanical energy is lost. In our fictional arrangement, the brine flows through a turbine before going to managed disposal. The turbine turns a shaft that assists the high-pressure pump; a motor supplies the remaining shaft demand. The Bureau of Reclamation's description of the Yuma plant gives a real example of pressurised reject water driving turbine units that assist pumps, although its historical agricultural-drainage system is not our fictional seawater case. Follow the two paths separately: water and dissolved salts pass through pipes, while torque is transferred through a mechanical connection. The turbine reduces input demand without turning its brine into product or creating a second water supply.
Each efficiency connects two named quantities. Pump efficiency ηp = useful hydraulic energy divided by pump shaft energy. Motor efficiency ηm = useful motor shaft energy divided by motor electrical input. Turbine efficiency ηt = useful turbine shaft energy divided by hydraulic energy released by the brine. Here ηp = 0.80, ηm = 0.90 and ηt = 0.75 are invented constant values, not equipment ratings. Feed hydraulic energy is Δp Vf; brine energy available across the turbine is Δp Vb under our declared equal-pressure-drop approximation. Pump shaft demand is Δp Vf/ηp, recovered shaft assistance is ηt Δp Vb, and motor electricity is their difference divided by ηm. Subtracting recovered shaft energy directly from electrical input would mix boundaries. An isobaric pressure exchanger transfers energy differently and would need its own model.
The original account delivers 40 m³ of product per day. Feed hydraulic energy is 166.6667 kWh/day, the pump requires 208.3333 kWh/day at its shaft, and the brine turbine supplies 75 kWh/day of useful shaft assistance. The remaining motor shaft demand is 133.3333 kWh/day, requiring 148.1481 kWh/day of electricity at the declared motor efficiency. Dividing by product volume gives 3. kWh/m³. Without the turbine, the same fictional pump and motor require 231.4815 kWh/day, or 5.7870 kWh/m³ of product. The recovered energy circulates inside the chosen boundary; it is not an extra external energy source. These figures omit intake, pretreatment, post-treatment, delivery and auxiliary services. Whole-plant energy cannot be obtained by treating this pumping account as the complete site meter.
Now keep the service target at 40 m³/day but raise recovery to 50%. Feed falls to 80 m³/day and brine to 40 m³/day. With the same declared feed and product concentrations, brine carries 2,786 kg of salt per day at 69.65 kg/m³. Its volume is smaller and its concentration is higher; its total salt load is also smaller because less feed enters. Give this changed case a separately prescribed 7.2 MPa pressure, leaving the three efficiencies unchanged. Its pump needs 200 kWh/day at the shaft, but the smaller brine stream supplies only 60 kWh/day of recovered shaft assistance. Motor electricity becomes 155.5556 kWh/day, or 3.8889 kWh/m³ of product. Under these assumptions, greater recovery increases electrical demand despite lower intake. Holding the old pressure unchanged would answer a different question.
An evidenced design choice therefore starts with several accounts rather than one winning percentage. Compare the same product service, measured feed composition and achievable operating conditions; then examine scaling and fouling, pump and turbine maintenance, treatment verification, supply reliability, disposal routes and costs borne by users. A smaller brine volume does not by itself establish less ecological harm: concentration, total contaminant load, receiving-water conditions and the discharge arrangement matter. EPA also describes alternatives such as interconnection or a suitable different water source, whose feasibility depends on local capacity. DOE's cited project-selection descriptions identify research questions about recovery, scaling and concentrate management; they do not certify completed improvements. Our lesson supports reasoning about those questions. Actual water-quality compliance, engineering approval, discharge permission, practical competence and assessment mastery remain separate evidence requirements.
Worked example: For one fictional day, pretreated feed is 100 m³, volumetric recovery is 0.40, feed salt concentration is 35 kg/m³ and product concentration is 0.35 kg/m³. Feed pumping and turbine brine depressurisation each use a declared 6 MPa pressure difference; membrane-train pressure loss is ignored. Pump hydraulic/shaft efficiency is 0.80, motor shaft/electrical efficiency is 0.90, and turbine shaft/brine-hydraulic efficiency is 0.75. A mechanically coupled turbine assists the pump shaft. Find the water and salt balances, each energy boundary, motor electricity and electricity per product volume. Compare the same model without energy recovery.
Choose a one-day basis before combining flow and energy. Product volume Vp = 0.40 × 100 = 40 m³/day and brine Vb = 100 − 40 = 60 m³/day. These are rates expressed on the same daily basis; they can equivalently be treated as the volumes passing during one day. Recovery is a volumetric fraction. It does not mean that 40% of the salt is removed, nor that the other 60% of the feed has disappeared.
Close the salt account. Feed carries 100 × 35 = 3,500 kg/day. Product carries 40 × 0.35 = 14 kg/day, leaving 3,486 kg/day in the brine. Its concentration is 3,486/60 = 58.1 kg/m³. Check that 14 + 3,486 = 3,500. Salt rejection relative to the declared feed concentration is 1 − 0.35/35 = 0.99, or 99%, while recovery remains 40%. Aggregate salt concentration is not a test for every contaminant or a drinking-water approval.
Convert pressure–volume work into the declared energy unit. A pascal is a joule per cubic metre, so 6 MPa × 100 m³/day = 600 MJ/day of feed hydraulic energy. Since 1 kWh = 3.6 MJ, this is 600/3.6 = 166.6667 kWh/day. Using MPa without its million-pascal conversion would lose a factor of one million. The 6 MPa input is a stipulated pressure difference, not a result inferred from the salt concentrations or a recommended pressure setting.
The pump's shaft must supply more energy than reaches the pressurised water. With ηp = hydraulic/shaft = 0.80, pump shaft demand is 166.6667/0.80 = 208.3333 kWh/day. Pump conversion loss is about 41.6667 kWh/day in this account. Retain the shaft label: this value is not yet motor electricity. In the arrangement being modelled, both the recovered turbine shaft contribution and the motor shaft contribution can meet portions of this same pump shaft demand.
Use the brine volume, not the entire feed volume, for turbine recovery. Under the equal pressure-drop approximation, available brine hydraulic energy is 6 MPa × 60 m³/day = 360 MJ/day = 100 kWh/day. The declared turbine converts 0.75 × 100 = 75 kWh/day into useful shaft assistance; the remainder is conversion loss. Brine still carries 60 m³/day and 3,486 kg/day of salt to its managed destination. Recovering pressure energy changes the shaft account, not the salt balance or the identity of the water stream.
Subtract like shaft quantities first: 208.3333 − 75 = 133.3333 kWh/day remains for the motor to supply. Divide by motor efficiency, giving 133.3333/0.90 = 148.1481 kWh/day of electricity. Product-normalised input is 148.1481/40 = 3. kWh/m³. With no turbine assistance, electricity would be 208.3333/0.90 = 231.4815 kWh/day, or 5.7870 kWh/m³. Carry exact values until reporting rounded results. These comparisons cover the declared pump/motor/turbine boundary and exclude other plant services and additional losses.
Answer: The fictional account supplies 40 m³/day of product and 60 m³/day of brine. Brine contains 3,486 kg/day of salt at 58.1 kg/m³; declared concentration rejection is 99%. Feed hydraulic energy is 166.6667 kWh/day, pump shaft demand 208.3333, recovered turbine shaft assistance 75, and remaining motor shaft demand 133.3333. Motor electricity is 148.1481 kWh/day or 3. kWh/m³ of product. The same pumping model without recovery requires 231.4815 kWh/day or 5.7870 kWh/m³. Values are rounded outputs from fictional parameters, with no whole-plant energy or product-safety inference.
Check your understanding: A second fictional design must deliver the same 40 m³/day of product. Recovery is 0.50, feed concentration remains 35 kg/m³ and product concentration 0.35 kg/m³. Its pumping and turbine pressure differences are separately prescribed as 7.2 MPa, and pump, motor and turbine efficiencies remain 0.80, 0.90 and 0.75. Find feed and brine volumes, brine salt concentration, pump and turbine shaft energies, motor electricity and electricity per product volume. Compare its intake, brine volume, concentration, salt load and electricity with the original. Does the higher recovery establish better energy performance, safer discharge or drinkable product?
Answer: Fixed product volume gives feed = 40/0.50 = 80 m³/day and brine = 80 − 40 = 40 m³/day. Feed salt is 80 × 35 = 2,800 kg/day, product salt remains 40 × 0.35 = 14 kg/day, and brine salt is 2,786 kg/day. Its concentration is 2,786/40 = 69.65 kg/m³. Feed hydraulic energy is 7.2 × 80/3.6 = 160 kWh/day; pump shaft demand is 160/0.80 = 200 kWh/day. Available brine hydraulic energy is 7.2 × 40/3.6 = 80 kWh/day, yielding 0.75 × 80 = 60 kWh/day of turbine shaft assistance. Motor electricity is (200 − 60)/0.90 = 155.5556 kWh/day, or 155.5556/40 = 3.8889 kWh/m³. Compared with the original, intake falls from 100 to 80 m³/day, brine volume from 60 to 40, concentration rises from 58.1 to 69.65 kg/m³, total brine salt falls from 3,486 to 2,786 kg/day, and motor electricity rises by 7.4074 kWh/day. Exact energy difference is 200/27 kWh/day; rounding the reported daily values earlier would slightly change their displayed subtraction. Higher recovery therefore does not establish an energy improvement under the changed pressure assumption. That 7.2 MPa is given rather than predicted from this bulk balance. Neither the reduced brine volume nor the stated salt rejection settles discharge acceptability or product compliance: other contaminants, treatment evidence, receiving conditions and applicable approvals remain to be evaluated. A full-site comparison must also include the services omitted from both pumping accounts.
Why: Credit requires preserving the fixed product service; distinguishing recovery from rejection and concentration from total salt load; subtracting turbine shaft energy from pump shaft demand before motor conversion; using correct pressure-volume units; and limiting the decision to the declared fictional boundary. No empirical pressure rating, chemical instruction, safe-water claim or assessment closure follows.