Count the charges: CMOS power, energy and deadlines
By How things work · myAudience
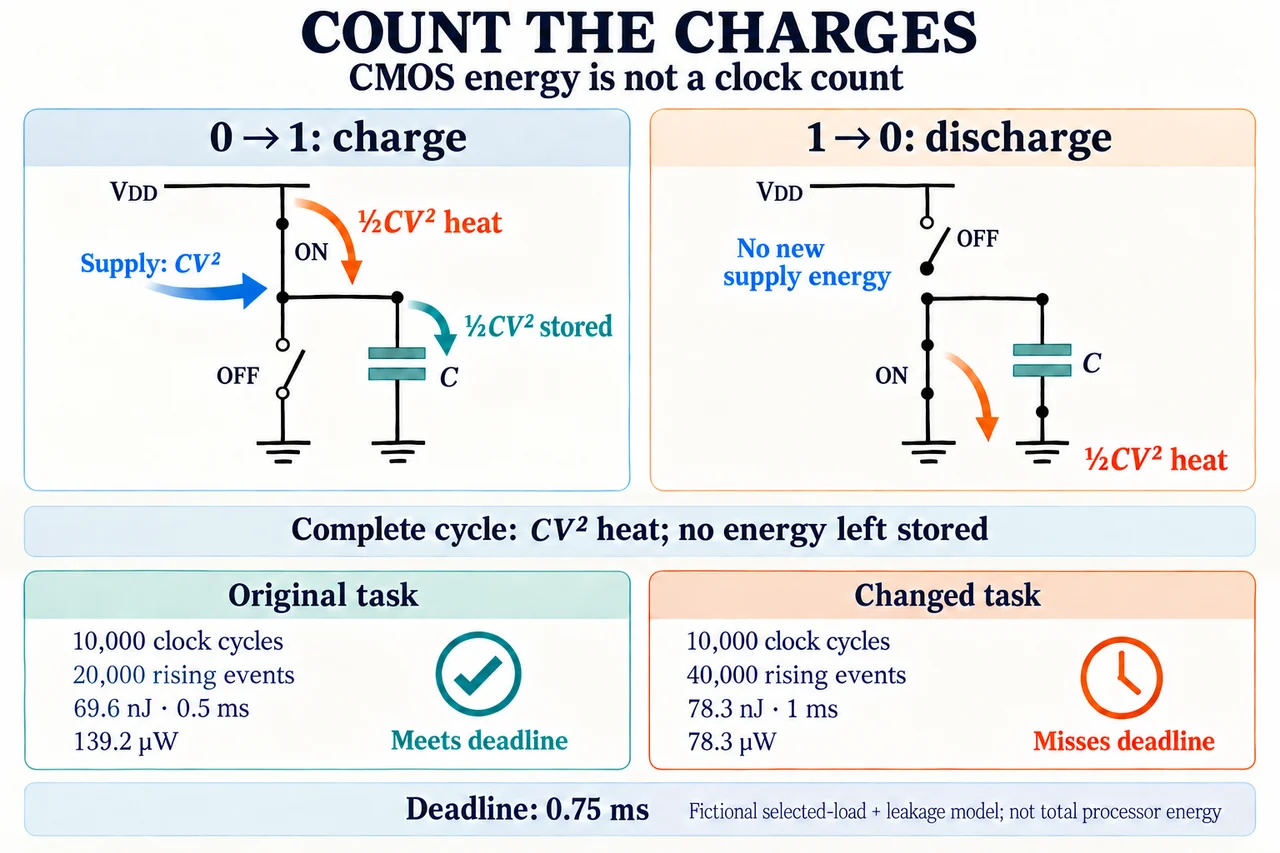
Image: illustration, not a documentary photograph. Ideal CMOS load-cycle and fictional selected-load-plus-leakage accounts; not total processor energy or operating guidance. · Operator-authored generated teaching illustration; scientific concept/model review retained separately.
Count the charges: CMOS power, energy and deadlines
A monitoring device might need to finish a calculation before a reading becomes too old to use. Making its logic consume fewer watts is helpful, but the calculation still has to finish on time. Power describes how quickly energy is being used; energy per task describes how much is used before the result is ready. Those goals can pull in different directions. Start by drawing the accounting boundary. Our fictional example includes the charging of 16 specified output-node capacitances and a supplied aggregate leakage current. It excludes the clock generator, unlisted internal nodes, memories, voltage regulators, other interface loads and any wake-up overhead. The numbers therefore describe a selected part of a circuit, not a processor, board or battery total. The previous CMOS lesson explains which complementary switch connects an output to a supply rail. Here we follow what happens to energy when that output changes, then ask whether an apparent saving meets the user's deadline. All voltages, currents and delays below are supplied teaching assumptions rather than specifications for operating real hardware.
Consider one linear capacitance C whose voltage rises from zero to a fixed supply voltage V. Its final charge is Q = CV. Because the supply holds V constant while providing that charge, it delivers VQ = CV² of energy. The capacitor does not store all of this input. Integrating C v dv from zero to V gives stored energy ½CV²; the remaining half is dissipated along the charging path. When the output later falls to zero, the ideal supply delivers no new energy to this load. The capacitor releases its stored half through the discharge path. A complete charge-and-discharge cycle therefore dissipates CV² and returns the capacitor to its original state. This is the ordinary dissipative switch model, without charge recovery. It does not include current flowing directly between the supply rails while real transistors overlap in conduction. If the observation ends with the node still high, ½CV² remains stored. Calling the entire supply input immediate heat would then lose part of the energy account.
The next question is how often that charging event actually happens. A reference clock may tick while many outputs remain unchanged. Define alpha, written α, as the mean number of output 0→1 events per listed node per reference-clock cycle. With N identical nodes and K reference cycles, the rising-event count is NαK. It is neither the count of both rising and falling edges nor the fraction of time a node is high. It also need not equal the activity at a circuit's input. Brief unintended transitions, called glitches, can add events between clock edges; an average event count can even exceed one. For this example every counted event makes a complete rail-to-rail charge, and the task starts and finishes with every listed capacitance discharged. Partial glitches require a more detailed voltage trace and are excluded. If the reference frequency is f cycles per second, the mean charging rate per node is αf. Thus selected capacitive energy is NαKCV², while average capacitive power is NαfCV². Frequency appears in the power expression because it changes events per second, not the energy of each event.
Our supplied task takes K = 10,000 reference cycles. There are N = 16 listed nodes, each with C = 2 pF, operated in the example at V = 1.2 V and f = 20 MHz. The supplied activity is α = 1/8. Picofarads are 10⁻¹² farads and megahertz means 10⁶ cycles per second, so the units must be converted before combining the numbers. Each rising event draws 2 × 10⁻¹² × 1.2² = 2.88 pJ from the supply. The event stores 1.44 pJ and dissipates 1.44 pJ during charging; its eventual discharge dissipates the stored 1.44 pJ. Across the task, 16 × (1/8) × 10,000 gives 20,000 rising events. Their capacitive supply energy is 57.6 nJ. Finishing 10,000 cycles at 20 MHz takes 0.5 ms, giving average capacitive power of 115.2 µW. The corresponding falling transitions complete the heat account; they do not draw a second CV² from the ideal supply. No energy for unlisted capacitances can be inferred from this sum.
A real CMOS circuit can consume power while its logical outputs stand still. Leakage is distinct from our selected load-charging account, and the example supplies a whole-boundary leakage current of 20 µA. Multiplying by 1.2 V gives 24 µW. During the task's 0.5 ms this contributes another 12 nJ, so selected energy is 57.6 + 12 = 69.6 nJ and selected average power is 139.2 µW. These are still partial hardware totals. For instance, TI's power-dissipation capacitance Cpd is a measured equivalent that can already include internal charging and overlap current. Adding Cpd indiscriminately to those same explicitly counted internal effects would double-count them. Now imagine halving only the reference frequency while leaving voltage, activity, task cycles and supplied leakage unchanged. The fixed event count and capacitive energy stay the same, but runtime doubles and leakage energy becomes 24 nJ. Selected task energy would be 81.6 nJ despite lower average power. A smaller watt reading alone cannot establish that a fixed task saves energy.
Timing is a separate constraint. The supplied critical logic path takes 35 ns. Add a combined register overhead of 5 ns, representing the clock-to-output and setup contributions included in this fictional budget, and a further 5 ns for clock uncertainty. The total is 45 ns. A 20 MHz clock has a 50 ns period, so this supplied path budget fits. The task also finishes in 0.5 ms, before its 0.75 ms deadline. Neither check is a certificate that a real device can operate at this voltage or frequency. Other paths, hold-time constraints, pulse widths, noise margins, temperature, interconnect and the actual product's specifications still need examination. Slow or floating CMOS inputs can also cause excess through-current or false output transitions, invalidating a simple clean-event estimate. Increasing a clock because an energy calculation looks attractive does not make those electrical conditions disappear. Likewise, lowering a supply voltage can change propagation delays and valid logic levels. Here the alternative delay is supplied explicitly; it is not predicted by a voltage ratio or a fitted transistor model.
The alternative setting illustrates why a fair comparison must preserve the task and count its events. Supply voltage becomes 0.9 V, reference frequency becomes 10 MHz, activity becomes 1/4, and supplied aggregate leakage becomes 15 µA. The task still uses 10,000 cycles and the same 16 capacitances. Each charge now draws only 1.62 pJ, but the event count doubles to 40,000. Capacitive energy becomes 64.8 nJ: the ratio to the original is 2 × (0.9/1.2)² = 9/8. Runtime also doubles to 1 ms. Leakage power falls to 13.5 µW, yet leakage energy rises to 13.5 nJ because that smaller power lasts longer. Selected task energy is 78.3 nJ, averaging 78.3 µW. Average power falls, but energy rises by 8.7 nJ and the deadline is missed. Its supplied 80 ns critical path, with the same two 5 ns allowances, fits the present 100 ns period. Completing the task within 0.75 ms needs at least 13.333… MHz, while the supplied 90 ns budget permits at most 11.111… MHz. No clock frequency satisfies both limits in this model.
A useful revision investigates unnecessary work rather than celebrating the lower power figure. If the alternative setting could reduce alpha to 1/8 without adding cycles, selected capacitive energy would become 32.4 nJ and leakage would remain 13.5 nJ, totaling 45.9 nJ. The task would still take 1 ms and miss its deadline. More generally, at the alternative voltage, frequency and leakage, equal selected energy occurs at alpha = 187/864, approximately 0.216435. This threshold is specific to the supplied accounting boundary, not a universal CMOS target. Activity isolation prevents unnecessary data transitions; clock gating suppresses selected clock pulses; power gating disconnects supply from selected circuitry. They have different costs and cannot be treated as interchangeable promises. Added control logic, retained state, wake-up time and leakage changes need evidence before extending our calculation. A defensible design choice must meet the user's deadline, preserve the result's correctness and account for those costs. The model teaches which measurements to seek; it does not establish total processor energy, product reliability or a safe operating voltage. All practical and assessment requirements remain open.
Worked example: A fictional logic block has 16 specified load nodes, each 2 pF, supplied at 1.2 V. A fixed task uses 10,000 reference cycles at 20 MHz. The measured mean rising-event count is 1/8 per node per cycle. Whole-boundary leakage current is stipulated as 20 µA. All load nodes start and end discharged; through-current and other hardware energy are excluded. Calculate supply energy, selected power and task energy. A supplied critical path of 35 ns plus 5 ns combined register overhead and 5 ns uncertainty must fit a period. Does the task also meet a 0.75 ms deadline?
Convert capacitance to 2 × 10⁻¹² F and frequency to 20 × 10⁶ cycles/s. For one complete charge, supply energy is CV² = 2 × 10⁻¹² × 1.2² = 2.88 pJ. The high-state capacitor stores half, 1.44 pJ, and the pull-up dissipates 1.44 pJ. Its later discharge dissipates the stored 1.44 pJ without drawing new ideal supply energy. Start/end discharged states let us identify complete-cycle supply energy with complete-cycle heat; a final high state would require a stored-energy term.
Use the specified rising-event definition: NαK = 16 × (1/8) × 10,000 = 20,000 charges. Do not substitute 16 × 10,000 merely because there are 10,000 clock ticks. Do not double the count for falling edges either: the falling edge releases energy already stored by the preceding charge. The count is supplied for the full task, including its return to discharged states, and assumes each charge reaches the supply rail.
Calculate task duration t = K/f = 10,000/(20 × 10⁶) = 0.0005 s = 0.5 ms. Capacitive supply energy is 20,000 × 2.88 pJ = 57.6 nJ. Dividing by 0.5 ms gives capacitive power 115.2 µW; equivalently NαfCV² gives the same result. This cross-check separates joules per completed task from joules per second. It includes the listed load capacitances only, not every internal transistor or the clock generator.
The supplied aggregate leakage power is VI = 1.2 V × 20 µA = 24 µW. During 0.5 ms, leakage energy is 24 µW × 0.5 ms = 12 nJ. Add the distinct selected ledgers: task energy is 57.6 + 12 = 69.6 nJ, and average power is 115.2 + 24 = 139.2 µW. Leakage persists throughout the supplied task duration even between switching events. Internal overlap current and the excluded hardware loads remain outside this sum.
Check the supplied timing budget independently of energy. The critical path, combined register overhead and uncertainty give 35 + 5 + 5 = 45 ns. A 20 MHz reference has period 1/f = 50 ns, so this abstract constraint passes. The 0.5 ms task duration also meets the 0.75 ms deadline. These are two different comparisons: a path may fit each cycle while the total task still finishes too late. They do not replace full timing, noise or product operating-condition checks.
Consider halving frequency alone under the original voltage, activity, cycle-count and leakage assumptions. Task duration becomes 1 ms while the 20,000 charges still use 57.6 nJ. Leakage now uses 24 nJ, so selected task energy becomes 81.6 nJ. Average power becomes 81.6 µW, which is lower, yet the task uses more energy and misses the deadline. This counterexample explains why a design revision needs both fixed-work energy and service-time evidence, not merely a lower power reading.
Answer: Each complete charge draws 2.88 pJ, split into 1.44 pJ of charging heat and 1.44 pJ of stored energy; discharge dissipates the stored half. There are 20,000 charges in 0.5 ms, giving 57.6 nJ capacitive energy and 115.2 µW capacitive power. Supplied leakage adds 12 nJ and 24 µW. Selected totals are 69.6 nJ and 139.2 µW. The supplied 45 ns timing budget fits the 50 ns period; 0.5 ms meets the 0.75 ms task deadline. Halving frequency alone gives 81.6 nJ over 1 ms: lower average power, higher energy and a missed deadline. These totals exclude clocks, unlisted internal nodes, overlap current, regulators and other hardware; none establishes safe real-device operation.
Check your understanding: Keep the task, capacitances and start/end states unchanged. A proposed 0.9 V setting operates at 10 MHz with alpha = 1/4 and aggregate leakage of 15 µA. Its supplied critical path is 80 ns; combined register overhead and uncertainty are still 5 ns each. Does lower average power establish a better energy/deadline choice? Calculate both energies and determine whether speeding this setting enough could meet the 0.75 ms deadline under the supplied timing limits. Then evaluate reducing alpha to 1/8.
Answer: Per charge, the supply delivers 1.62 pJ; storage and each half-cycle heat are 0.81 pJ. The 40,000 rising events use 64.8 nJ. Runtime is 1 ms, giving 13.5 nJ leakage and 78.3 nJ selected energy, averaging 78.3 µW. Power falls, but energy rises by 8.7 nJ and runtime misses the deadline. The 90 ns timing budget fits the present 100 ns period. Meeting the deadline needs at least 13.333… MHz; the supplied 90 ns budget permits at most 11.111… MHz, so no frequency satisfies both. At alpha = 1/8, selected energy falls to 32.4 + 13.5 = 45.9 nJ, but runtime remains 1 ms. The equal-energy threshold is alpha = 187/864 ≈ 0.216435 under these V, f and leakage conditions. None of these estimates establishes a safe voltage or clock rate; actual timing, functional correctness and overhead evidence are still needed. The event energy ratio is 2 × (0.9/1.2)² = 9/8, explaining the rise from 57.6 to 64.8 nJ despite the lower voltage.
Why: Count rising charges using NαK, then account for leakage over K/f. Lower voltage reduces energy per event but does not prevent additional events or longer leakage exposure. Compare the deadline-required frequency with the independently supplied timing upper bound; their incompatible ranges rule out solving the changed case by clock adjustment alone. Reducing activity saves selected energy without shortening a fixed-cycle task. Real timing and overhead evidence must precede any hardware choice.