Why faster arithmetic can still wait for memory
By UK A Level Computer Science · independent study · myAudience
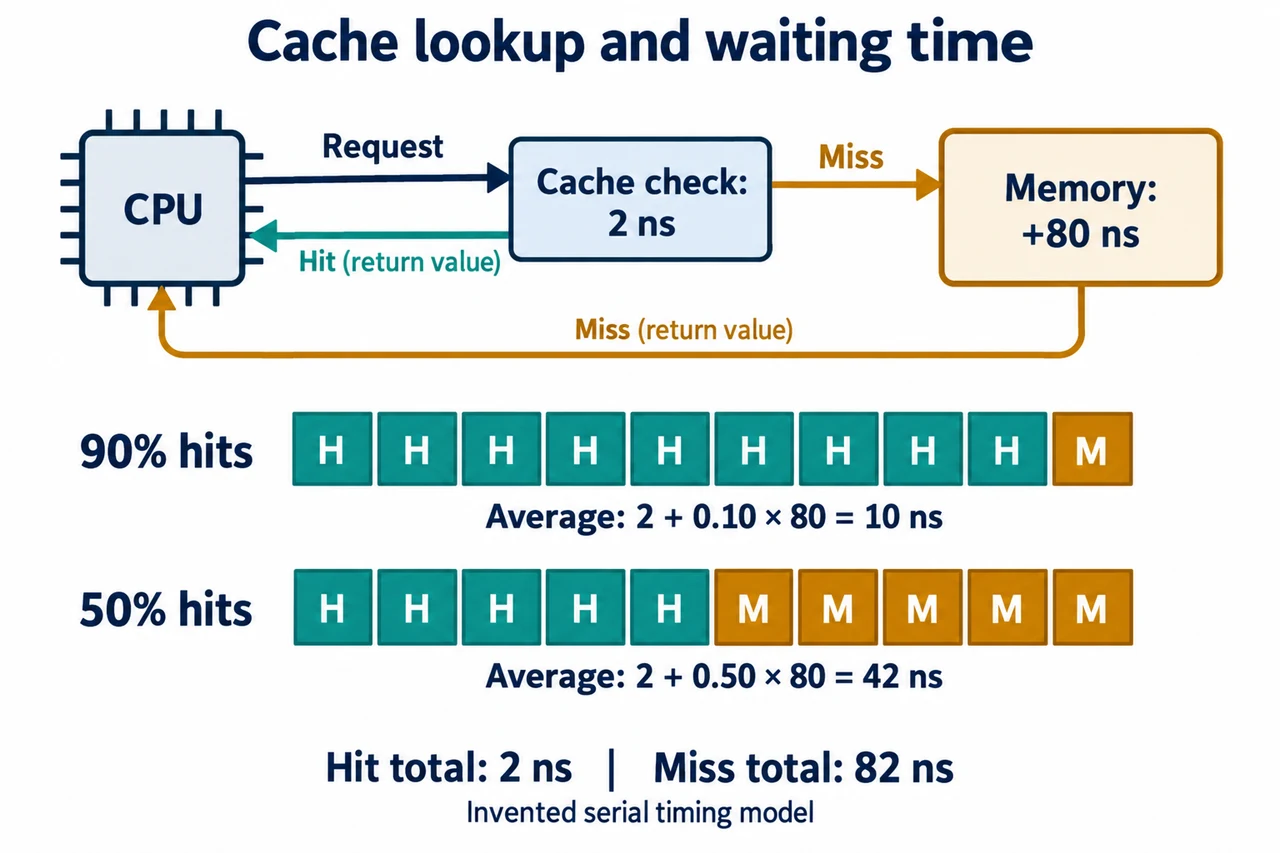
Image: illustration, not a documentary photograph. The invented serial model checks the cache for 2 ns on every request and adds an 80 ns memory penalty only on a miss. Hit time is 2 ns; total miss time is 82 ns. Nine hits and one miss give an average 10 ns; five hits and five misses give 42 ns. Equal-width tokens count requests, not time, and box sizes are not physical capacities. Return arrows indicate data returning to the CPU. The 160-pixel preview supports recognition, not reading the timing formulas. · Original project scientific illustration; defined teaching model, not a calibrated measurement or exam-board figure.
Why faster arithmetic can still wait for memory
A processor executes instructions, but instructions often need values that are not ready at the instant arithmetic could begin. A register operand, a cached value and a main-memory access have different routes. Distinguish the instruction's meaning from the implementation that obtains its operands and schedules work. A program can contain the same operations on two machines yet finish at different times because memory service, instruction dependencies and available execution resources differ. The existing fetch/decode/execute account explains the logical instruction cycle; this lesson adds a bounded timing model rather than replacing that account with a photograph of a modern processor.
Scope
Bounded processor-performance teaching lesson, linked to the existing the related topic requirement; not a duplicate new official demand. Cache arithmetic and stream scheduling are explicit educational extensions of that grouping. Pipeline overlap is enrichment rather than a claim that lists it as a mandatory item. GCSE115 already teaches memory roles and fetch/decode/execute; those foundation lessons are prerequisites to reuse, not rewrite. All timings below are invented, not measurements of the user's server or a specific chip.
Latency is the elapsed time from a request to its response. Throughput is work completed per unit time; memory bandwidth describes bytes transferred per unit time. They are not interchangeable. A device can deliver a long stream efficiently after an initial delay, while a program that must wait for each result before requesting the next value cannot hide that delay in the same way. Always state the measured operation, request size and dependency pattern. A large advertised transfer rate cannot alone predict the time to follow a chain of unrelated addresses, and a short single-request latency cannot alone establish the sustained rate of many requests.
A cache retains selected memory contents close to the processor. A hit finds the requested content there; a miss requires another route. Temporal locality means using recently accessed content again, while spatial locality means using nearby content that a transferred cache line may already include. The actual line size, capacity, placement and sharing depend on the implementation. Larger caches can retain more working data but do not guarantee that a particular access hits. A stream larger than cache, competing uses or an unfortunate mapping can still cause misses. Do not treat the illustration's box areas as real capacities or assume that every CPU uses the same hierarchy.
Define the timing convention before calculating an average. In our one-level serial model, each request first spends 2 ns checking the cache. A miss then adds 80 ns to retrieve its value; therefore a hit totals 2 ns and a miss totals 82 ns. If the miss fraction is m, the average is (1−m)×2+m×82 = 2+80m ns. The extra 80 ns is a miss penalty, not the complete miss time. Multiplying 82 by the miss rate and then adding 2 for every request double-counts the cache lookup on misses. Conversely, omitting the first lookup understates their total.
Suppose 100 independent accesses in the accounting trace contain 90 hits and 10 misses, with no overlapping requests or additional overhead. Their total service time is 90×2+10×82=1,000 ns, giving 10 ns per access. Reducing the miss count to five gives 95×2+5×82=600 ns, or 6 ns per access. The serial model's speed-up for this memory service is 1,000/600=5/3, approximately 1.67. That ratio is not a promised whole-program speed-up: computation, instruction fetching, I/O and overlapping work were excluded. A measured miss fraction belongs to a defined workload, not permanently to the cache itself.
A second model separates throughput from single-item latency. Choose three stages, each taking one 4 ns cycle, and four independent items A–D. Without overlap, four items require 12 stages and 48 ns. With a stage for each position and no stalls, A uses stages 1, 2 and 3 in cycles 1, 2 and 3; B begins in cycle 2 and finishes in cycle 4; D finishes in cycle 6. Total time is (4+3−1)×4=24 ns. Each item still spends three cycles, or 12 ns, in the ideal pipeline. Overlap improves the stream's completion rate, not the stipulated single-item latency.
Dependencies and resources constrain that ideal. If B needs A's final result before entering stage 1, B cannot start in cycle 2 under this convention. Four wholly dependent items return to starts in cycles 1, 4, 7 and 10 and finish in cycle 12. Branch decisions or shared resources can introduce other waits. Real processors may use forwarding, prediction, multiple issue and out-of-order scheduling, but those mechanisms require their own model; mentioning them does not erase a dependency. More cores help only where useful work can run concurrently and memory service supports it. A higher clock rate also does not automatically shorten a delay specified in nanoseconds by another device.
Image: illustration, not a documentary photograph. The invented serial model checks the cache for 2 ns on every request and adds an 80 ns memory penalty only on a miss. Hit time is 2 ns; total miss time is 82 ns. Nine hits and one miss give an average 10 ns; five hits and five misses give 42 ns. Equal-width tokens count requests, not time, and box sizes are not physical capacities. Return arrows indicate data returning to the CPU. The 160-pixel preview supports recognition, not reading the timing formulas.
Evaluate an upgrade by the bottleneck and the question. Measure representative workloads and distinguish cold access, repeated access and competing activity before interpreting a cache change. State whether a proposed improvement alters the hit rate, lookup time, miss penalty, compute time or possible overlap. A faster CPU may consume less time computing while memory waits stay fixed; a larger cache may reduce misses while its lookup becomes slower. Energy, cost and reliability matter alongside completion time. This lesson's invented serial and three-stage models are explanatory tools, not benchmarks, silicon layouts or configuration advice for a production server. Complete architecture coverage and examination assessment remain open.
Sources and remaining work
Architecture source material the related topic/the related topic confirms the instruction-cycle and listed performance factors; existing canonical the related topic was unbound in the preserved 24-lesson source snapshot. Actual Arm Learning Paths memory-latency and cache-hierarchy bodies distinguish request delay and implementation-dependent hierarchy/locality. The vendor's illustrative latency table is not used as a measured or internally consistent benchmark here. Intel's 2023-2 FPGA pipelining body supports distinguishing streamed throughput from latency in that hardware context; our equal-stage schedule is an original abstraction, not an Intel CPU trace. URLs:; https://learn.arm.com/learning-paths/cross-platform/memory-latency/what-is-latency/; https://learn.arm.com/learning-paths/servers-and-cloud-computing/memory-subsystem/cache-hierarchy/; https://www.intel.com/content/www/us/en/docs/oneapi-fpga-add-on/optimization-guide/2023-2/pipelining-001.html. Sources checked 6 October 2026. Deeper hierarchy and independent assessment remain open. The selected cache illustration and its 1280-, 640- and 160-pixel variants have been visually checked; the full caption distinguishes request counts from duration. Full qualification coverage and assessment remain open.
Worked example: Question: A workload has 200 serial data accesses. Design P has 2 ns cache lookup, 80 ns additional miss penalty and 20 misses. Design Q has 3 ns lookup, the same additional penalty and 10 misses. Calculate each total and average, then the memory-service speed-up. Separately schedule four independent items through the stipulated three 4 ns stages, and explain why that schedule cannot be applied unchanged to a chain of dependent items.
P has 180 hits at 2 ns and 20 misses at 82 ns, giving 360+1,640=2,000 ns and average 10 ns. Q has 190 hits at 3 ns and 10 misses at 83 ns, giving 570+830=1,400 ns and average 7 ns. Equivalently, their averages are 2+0.10×80=10 and 3+0.05×80=7 ns. P-time divided by Q-time is 2,000/1,400=10/7, approximately 1.43. Q's larger lookup cost does not cancel its stipulated miss reduction in this trace. No cache sizes or actual hardware performance have been inferred.
The independent-item schedule is: cycle 1 A1; cycle 2 A2/B1; cycle 3 A3/B2/C1; cycle 4 B3/C2/D1; cycle 5 C3/D2; cycle 6 D3. Subscripts denote stages, not different arithmetic instructions. The last item finishes at 24 ns, compared with 48 ns without overlap; each item still occupies 12 ns from entry to completion. If the next item needs the predecessor's final result before entry, it cannot start until the predecessor completes. Starts become cycles 1, 4, 7 and 10, so the last result is available at 48 ns. This is a specified dependency model, not a universal rule for all processors.
Answer: P has 180 hits at 2 ns and 20 misses at 82 ns, giving 360+1,640=2,000 ns and average 10 ns.
Check your understanding: Question: A revised design R has 4 ns lookup and the same 80 ns additional miss penalty. What miss fraction makes its average service time less than P's 10 ns? Then a processor's computation time halves while a task previously spent 60 ms computing and 40 ms in non-overlapped memory waits. Calculate the new total and whole-task speed-up. Does doubling clock speed prove a twofold speed-up?
Answer: R's average is 4+80m ns. Requiring 4+80m<10 gives m<6/80=0.075, so the miss fraction must be below 7.5%; equality gives a tie. The bound assumes the stipulated fixed costs and serial requests. It is not a universal miss-rate threshold for other workloads or devices. At 5% misses, the average would be 8 ns; at 10%, it would be 12 ns, illustrating why hit-rate improvements must be compared with lookup costs.
Halving the stipulated compute time makes it 30 ms, while memory waits stay 40 ms. New total is 70 ms versus 100 ms; speed-up is 100/70=10/7, approximately 1.43, not 2. Even eliminating compute time entirely leaves 40 ms in this model and bounds the speed-up at 100/40=2.5. Doubling a clock does not itself establish that compute time halves or that other delays remain unchanged; those were separate assumptions in the question. Overlap would require a different accounting model, and adding the same wait twice would be invalid.
Why: The calculation needs an explicit boundary around each timing quantity. Cache lookup occurs for hits and misses, while the penalty is additional only on misses. A speed-up is old elapsed time divided by new elapsed time for the same defined work. The revised task demonstrates a bottleneck: improving the compute component leaves a fixed waiting component. The pipeline example then distinguishes stream throughput from item latency and explains precisely which dependency prevents overlap. These distinctions are more informative than comparing a clock frequency or cache capacity in isolation.