A full reservoir still needs enough head and flow
By How things work · myAudience
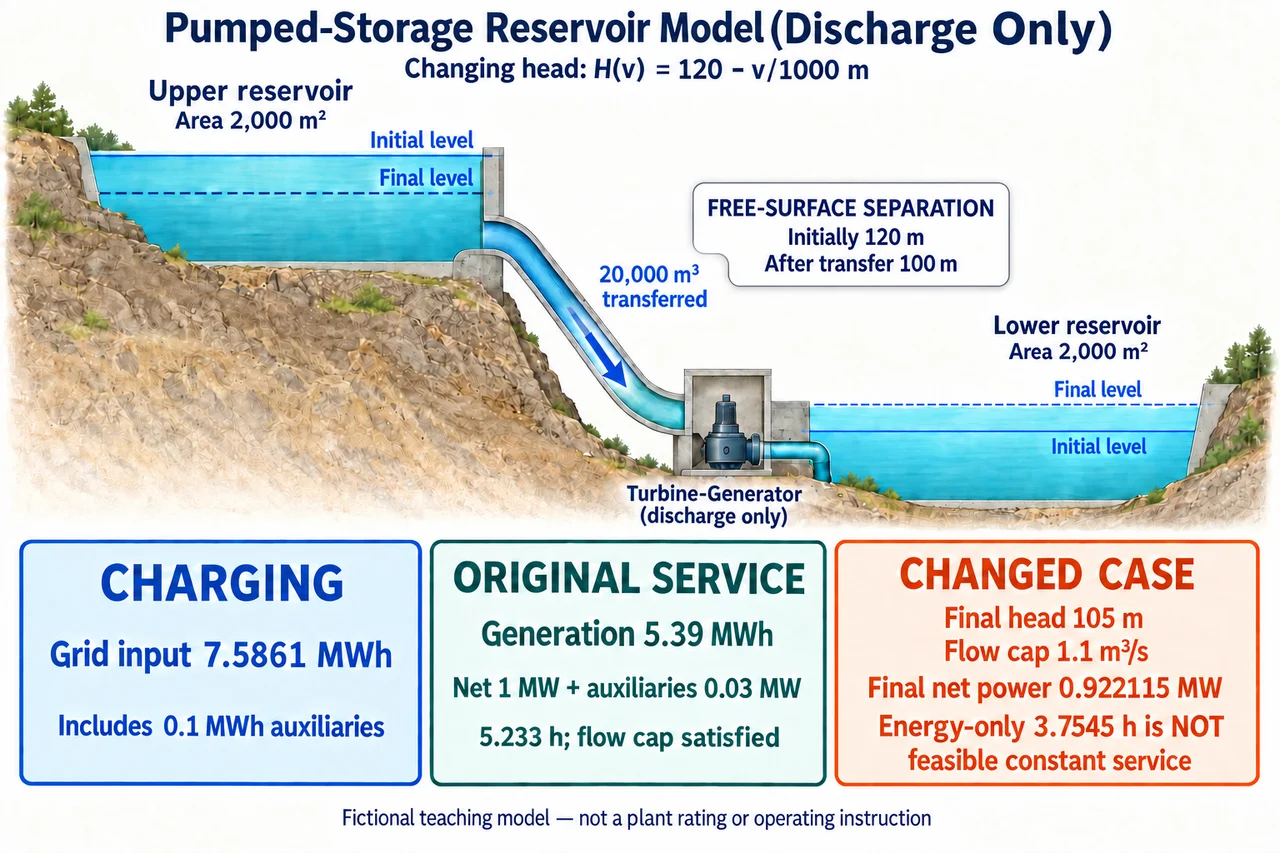
Fictional pumped-storage teaching model. Transferring water lowers the upper surface and raises the lower surface, reducing their separation from 120 m to 100 m. Charging and discharge ledgers are separate. The changed example’s 3.7545-hour energy-only duration is not feasible constant service because the flow limit is exceeded. Image: illustration, not a documentary photograph. Geometry is schematic and not to scale; no plant rating or operating instruction. · Operator-authored generated illustration; scientific model reviewed separately.
A full reservoir still needs enough head and flow
Pumped storage provides electricity at a different time from the electricity used to charge it. Water moved uphill gains gravitational potential energy; returning it downhill can transfer part of that energy through a turbine and generator. The useful question is not merely how much water is present, but how much energy can be recovered and at what rate. We will extend the earlier fixed-head mechanism with changing reservoir levels and an independent flow constraint. Every dimension, efficiency and service target below is invented for teaching. A successful calculation for this model is not a plant rating, a dam operating instruction or evidence that a real installation can meet the same request.
Let both reservoirs have constant horizontal area A=2,000 m² and initially differ in free-surface elevation by 120 m. After volume v has moved from the upper reservoir to the lower one, the upper surface has fallen by v/A and the lower has risen by v/A. Their separation has therefore fallen by 2v/A, giving H(v)=120−v/1000 metres when v is in cubic metres. This H is the stipulated free-surface potential difference, not a measured pipe-pressure profile. The model excludes outside inflow, leakage and evaporation during the cycle, assumes usable water throughout the stated transfer and treats the free surfaces as uniform. A real reservoir's changing cross-section could give a different relationship.
Each small volume dv has mass ρ dv, so transferring it through the current head releases gravitational energy dE=ρgH(v) dv. Use the supplied density ρ=1,000 kg/m³ and g=9.8 m/s². Integrating from zero to transferred volume V gives E=ρg(120V−V²/2000). For a linear head relation this is also ρgV times the mean of the initial and final heads. It is not generally valid to replace an arbitrary changing head by its endpoint average. For V=20,000 m³, final head is 100 m and mean head is 110 m, giving 21.56 GJ or 539/90 MWh. Using 120 m for every parcel would overestimate the gravitational energy by the ratio 12/11, about 9.09%.
Keep the conversion boundaries separate. Define charging efficiency as the gravitational energy gained divided by the charging electricity that performs that conversion; define discharge efficiency as generated electricity divided by the released gravitational energy. In this model those lumped efficiencies already account for the specified conversion and hydraulic losses, so subtracting another guessed pipe loss would count some losses twice. Auxiliary electricity is then accounted for separately. With charging efficiency 0.8 and fixed charging auxiliary energy 0.1 MWh, total charging grid input is (539/90)/0.8+0.1=2731/360 MWh. Discharge efficiency 0.9 gives 5.39 MWh of generation before discharge auxiliaries. Constant efficiencies are supplied simplifications, not real machine maps.
An energy total does not by itself specify a sustained service. Suppose the requested net grid delivery is 1 MW and discharge auxiliaries consume a constant 0.03 MW. The generator must then produce 1.03 MW while that service continues. With 5.39 MWh available from generation, the energy-only duration is 5.39/1.03=539/103 hours, about 5.233 hours. Net grid energy is 539/103 MWh; auxiliary energy is 0.03 times that duration, or 1617/10300 MWh. Those two accounts sum to 5.39 MWh. Treating auxiliaries as a fixed energy before calculating duration would be a different model: here their energy depends on how long they run.
Check the power constraint separately. Flow Q through the current head gives stipulated generated power P=ρgηdHQ, so the flow required for the 1.03 MW generation request is Q=1,030,000/(1,000×9.8×0.9×H), in m³/s. It grows as head falls. At 120 m it is 2575/2646 m³/s; at 100 m it is 515/441 m³/s, about 1.168. Both are below the supplied maximum flow 1.2 m³/s, so the original constant service is feasible within this model over the whole transfer. That conclusion assumes the defined efficiency, usable volume and flow limit remain valid. It establishes neither startup behavior nor ramping capability, turbine stability, electrical protection or safe water releases.
The full cycle's net electrical ratio now includes both auxiliary accounts. Divide delivered grid energy 539/103 MWh by charging grid input 2731/360 MWh to obtain 194040/281293, about 0.689815. It is below the product 0.8×0.9=0.72 because charging and discharge auxiliaries use additional electricity within the chosen boundary. An efficiency comparison is meaningless if one option includes auxiliary use and another excludes it. Neither this ratio nor a price difference identifies lifecycle emissions or local environmental impacts. Closed-loop storage describes the absence of an ongoing connection to an outside water body; it does not remove questions about water use, habitat, land, construction or affected communities. Full illustration description: Original conceptual discharge-only pumped-storage illustration with two fictional reservoirs of horizontal area 2,000 square metres each. A single descending water-flow arrow connects the upper reservoir to a turbine-generator and lower reservoir. Inside the upper reservoir, the final dashed free surface is below the initial surface; inside the lower, the final dashed free surface is above the initial surface. A text card states that free-surface separation is initially 120 metres and after a 20,000 cubic metre transfer is 100 metres; no geometric head measurement arrows are used. The supplied model is H(v)=120−v/1000 metres. Three separate cards distinguish charging grid input 7.5861 MWh including 0.1 MWh auxiliaries, original discharge generation 5.39 MWh supplying net 1 MW plus 0.03 MW auxiliaries for about 5.233 hours with its flow cap satisfied, and the changed case with final head 105 metres, flow cap 1.1 cubic metres per second and final net power 0.922115 MW. Its energy-only 3.7545-hour duration is explicitly not feasible constant service. This is a fictional schematic, not a plant rating, operating instruction, hydraulic machine map or safety approval. Full prose provides exact fractions, assumptions and changed-case critical head and volume; 160-pixel rendition is recognition only.
Changing volume and machine assumptions exposes two independent limits. Transfer 15,000 m³, use discharge efficiency 0.85, charging efficiency 0.75, charging auxiliaries 0.1 MWh, discharge auxiliary power 0.04 MW and maximum flow 1.1 m³/s. The head ends at 105 m. Even ignoring the flow limit, generation 3.9046875 MWh cannot supply the 4.16 MWh required for four hours of 1 MW net delivery plus auxiliaries. In addition, the required flow exceeds the cap before all the water has moved. A shorter energy-only duration must not be relabelled as feasible constant service. Sources and open scope: current US Department of Energy pumped-storage and hydropower-type pages explain charging/discharge and open/closed-loop distinctions; OpenStax College Physics 2e 7.3 supplies gravitational work and potential-energy reasoning, checked 6 October 2026. The reservoir model, values and questions are original. No publisher graphic, market headline or commercial performance figure is copied. Real hydraulic maps, operating design, safety, environmental approval, full technology-family assessment and complete engineering coverage remain open. The accompanying original illustration shows the fictional discharge-only reservoir model and separate electrical accounts; its geometry is schematic rather than a measured head profile. Its 160-pixel image is a recognition preview; use the full text and larger illustration for the numerical explanation.
Worked example: Two fictional reservoirs each have constant horizontal area 2,000 m², with initial free-surface head 120 m. Transfer 20,000 m³. Use density 1,000 kg/m³, g=9.8 m/s², charging efficiency 0.8, discharge efficiency 0.9, charging auxiliary energy 0.1 MWh, discharge auxiliary power 0.03 MW and maximum flow 1.2 m³/s. Find the gravitational energy, charging input and duration of net 1 MW service. Check the flow constraint and calculate the net cycle ratio.
Each reservoir surface changes by v/2,000 m in opposite directions, so the free-surface head is H(v)=120−v/1000 m. At V=20,000 m³ it is 100 m. The linear relation has mean head (120+100)/2=110 m. The changing levels must both be included; allowing only the upper surface to fall would give a different and incorrect head for these stipulated equal areas.
Integrate the incremental gravitational account: E=1,000×9.8×∫₀²⁰⁰⁰⁰(120−v/1000)dv=1,000×9.8×(2,400,000−200,000)=21,560,000,000 J. Divide by 3.6×10⁹ J/MWh to obtain 539/90 MWh. Holding the initial head 120 m throughout gives 12/11 times this value, so its 9.09% overestimate is a measurable model error.
Charging conversion input is E/0.8=539/72 MWh. Add the separate fixed charging auxiliary energy 0.1 MWh to obtain 2731/360 MWh. Generation during discharge is E×0.9=539/100 MWh=5.39 MWh. The two efficiencies act on different conversion directions; neither includes the separately stated auxiliary accounts.
Net 1 MW plus discharge auxiliaries 0.03 MW requires generation 1.03 MW. The available generation gives duration 5.39/1.03=539/103 h. Net delivered energy is 539/103 MWh, while auxiliaries use (3/100)×(539/103)=1617/10300 MWh. Their exact sum is 539/100 MWh, closing the discharge electricity account without treating duration-dependent auxiliary use as a fixed number.
The required flow is Q=1,030,000/(ρgηdH). At the initial head it is 2575/2646 m³/s≈0.9732; at the final head it is 515/441 m³/s≈1.1678. Head falls monotonically, so the final value is the largest requirement. It remains below 1.2 m³/s; hence this service is feasible throughout the stipulated transfer under the stated constant efficiency and flow assumptions.
The full net cycle ratio is (539/103)/(2731/360)=194040/281293≈0.689815. It is less than 0.72 because net grid output excludes discharge auxiliaries while charging input includes charging auxiliaries. This result belongs to the supplied cycle boundary and values. It is not evidence of a universal efficiency, emissions benefit, approved water release or operational safety.
Answer: Gravitational energy is 539/90 MWh; charging grid input is 2731/360 MWh; generation is 5.39 MWh. Net 1 MW service lasts 539/103 h≈5.233 h and satisfies the supplied 1.2 m³/s flow cap. The net electrical cycle ratio is 194040/281293≈0.689815, with both auxiliary accounts included.
Check your understanding: Keep the same reservoir areas, initial head, density and g, but transfer 15,000 m³ with discharge efficiency 0.85, charging efficiency 0.75, charging auxiliary energy 0.1 MWh, discharge auxiliary power 0.04 MW and maximum flow 1.1 m³/s. Can it deliver net 1 MW for four hours? Calculate the unconstrained energy-only duration, show the separate flow failure and find its critical head and transferred volume.
Answer: Final head is 105 m and mean head 112.5 m. Gravitational energy is 147/32 MWh; generation is 2499/640 MWh=3.9046875 MWh; charging grid input is 249/40 MWh=6.225 MWh. Four hours requires 4×1.04=4.16 MWh of generation, more than is available. Ignoring the flow cap, the energy-only duration is 12495/3328 h≈3.754507 h. It is not a feasible constant-service duration: final required flow is 20800/17493 m³/s≈1.189, exceeding 1.1. At 105 m and maximum flow, generation is 0.962115 MW and net delivery only 0.922115 MW. Setting 1.04 MW=ρg×0.85×Hcrit×1.1 gives Hcrit=1040000/9163 m≈113.499945 m. From H(v)=120−v/1000, this occurs after v=59560000/9163 m³≈6500.054567 m³, before the full transfer. Beyond that point the requested constant power violates the cap. A lower or varying-power schedule requires a separate model, not reuse of the unconstrained duration as a delivery promise.
Why: The changed case fails both a total-energy test and an instantaneous-flow test. Keeping them separate prevents sufficient water volume, a plausible average duration or a nominal power label from concealing the changing-head constraint. The exact auxiliary boundary also matters: four hours requires generation for both net delivery and the auxiliary load. Neither the hypothetical flow cap nor these calculations supply real hydraulic maps or a safe operating procedure.